
Page 13 - GEORptJul18
P. 13
3.0 Macro Economy
Georgia - Main Macro 2011 2012 2013 2014 2015 2016 2017 Indicators
GDP real growth (y/y, %)
7.2 6.4 3.4 4.6 2.9 2.7 5.0
GDP (per capita, $) 3,230.7 3,523.4 3,599.6 3,676.2 3,766.6 3,864.6 4,078.5
GDP: Final consumption expenditure, (GEL mn)
22,487.3 23,733.2 23,671.8 25,570.7 27,318.7 28,241.5 30,381.7
GDP: Gross capital formation, (GEL mn)
6,368.0 7,575.4 6,652.9 8,688.8 10,004.3 10,999.8 12,133.3
GDP: Exports, (GEL mn)
8,822.8 9,982.9 11,997.9 12,518.3 14,206.8 14,837.8 19,177.3
GDP: Imports, (GEL mn)
13,334.2 15,124.2 15,475.2 17,627.3 19,774.3 20,187.5 23,650.1
Source: bne IntelliNews, CEIC
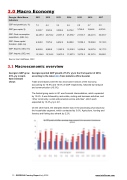
3.1 Macroeconomic overview
Georgia’s GDP grew 6.5% y/y in April, flash estimate shows
Georgia reported GDP growth of 5.3% y/y in the first quarter of 2018, according to the latest data from statistics office Geostat.
Trade and industry were the two most active sectors of the economy, accounting for 16.9% and 16.6% of GDP respectively, followed by transport and communication (10.3%).
The fastest going sector in Q1 was financial intermediation, which expanded by 13.6%. It was followed by real estate, renting and business activities, and “other community, social and personal service activities”, which each expanded by 13.4% y/y in Q1.
On the other hand, the sharpest decline was in the processing of products by the households segment, which contracted by 3.0%. Agriculture, hunting and forestry and fishing also shrank by 2.2%.
13 GEORGIA Country Report July 2018 www.intellinews.com
