
Page 43 - RusRPTMar19
P. 43
since 2003 (111 deals). Deal value however, remained steady compared to 2017 following a strong performance in the first half of the year.”
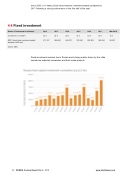
4.4 Fixed investment
Russia -Fixed capital investment 2012 2013 2014 2015 2016 2017 Mar-2018
Investment (% of GDP)
24.3 22.9 22.0 21.4 22.5 23.5 15.3
GDP: Gross fixed investment capital formation (USD mn)
471,337 496,982 428,573 276,240 280,350 342,294 58,303
source: CEIC
Fixed investment remains low in Russia and is being mainly driven by the state owned raw materials companies and their mega-projects.
43 RUSSIA Country Report March 2019 www.intellinews.com
