
Page 47 - RusRPTJun20
P. 47
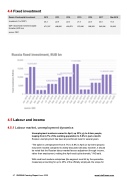
4.4 Fixed investment
Russia -Fixed capital investment 2012 2013 2014 2015 2016 2017 Mar-2018
Investment (% of GDP)
24.3 22.9 22.0 21.4 22.5 23.5 15.3
GDP: Gross fixed investment capital formation (USD mn)
471,337 496,982 428,573 276,240 280,350 342,294 58,303
source: CEIC
4.5 Labour and income
4.5.1 Labour market, unemployment dynamics
Unemployment numbers soared in April, up 23% y/y to 4.6mn people, leaping from 4.7% of the working population to 5.8% in just a month. Russian unemployment has been at post-Soviet lows for several years.
“The spike in unemployment from 4.7% to 5.8% in April (or by 0.8mn people) may seem modest compared to widely discussed US data, however, it should be noted that the Russian labour market favours adjustment through income, rather than employment, making the April result quite dramatic,” ING said.
With small and medium enterprises (the segment most hit by the quarantine measures) accounting for up to 25% of the officially employed, the scope for
47 RUSSIA Country Report June 2020 www.intellinews.com
