
Page 54 - RusRPTFeb19
P. 54
produce a whopping current account surplus of about 7% of GDP – Russia’s largest current account surplus since 2006.
The net capital outflow from the private sector increased substantially in 2018. The flow of direct investments from abroad into the Russian corporate sector (excl. banks) dried up almost entirely, while FDI outflows from Russia remained rather notable. Similar to 2017, banks’ capital outflow abroad mostly arose from decreases in their foreign liabilities.
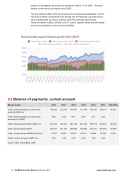
5.2 Balance of payments, current account
Russia -Trade 2012 2013 2014 2015 2016 2017 Mar-2018
Trade: External balance on goods and services (USD mn)
148,023 123,679 134,497 111,638 103,425 130,314 48,353
Trade: External balance on goods and services (% of GDP)
6.66 5.39 6.41 8.04 5.17 5.35 /
Trade: Goods exports (BoP) (USD mn)
Trade: Goods imports (BoP)
527,434 523,275 497,763 341,467 285,772 353,547 101,881
335,771 341,337 308,026 193,952 191,671 237,993 57,000
Trade: Current account BPM6 (USD mn)
71,282 34,801 58,432 68,375 25,664 35,350 18,321
Trade: Current account to GDP (%)
3.20 1.40 2.70 4.90 1.90 2.20 /
source: CEIC, World Bank, CBR
54 RUSSIA Country Report February 2019 www.intellinews.com
