
Page 30 - GEORptNov18
P. 30
Subsidies
359.3
419.97
541.4
95.5
114.6
Grants
935.1
1,020.28
968.6
229.2
206.4
Social benefits
3,150.1
3,313.18
3,324.3
832.2
846.5
Other expense
1,329.5
1,326.98
1,427.3
228.5
374.3
Net operating balance
-161.8
368.23
378.3
541.3
75.1
Change in nonfinancial assets
416.1
909.04
874.2
277.4
245.6
Total balance
-577.9
-540.81
-495.9
263.9
-170.5
Source: Finance Ministry
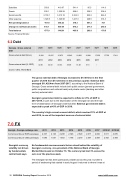
6.2 Debt
Georgia - Gross external debt
2Q16 3Q16 4Q16 1Q17 2Q17 3Q17 4Q17 1Q18 2Q18
Gross external debt ($ mn)
15,281 15,697 15,872 16,042 16,660 16,881 17,250 17,759 17,411
2011 2012 2013 2014 2015 2016 2017
Gross external debt (% GDP)
32.46 32.53 33.92 35.38 41.28 41.6 /
source: CEIC, World Bank
The gross external debt of Georgia increased to $17,470mn in the first quarter of 2018 from $17,203.5mn in the previous quarter. External debt averaged $11,420.4mn from 2007-2017, according to the National Bank of Georgia. Gross external debt include both public sector (general government, public corporations and national bank) and private sector (banking and other sectors) external debt.
Georgia’s government debt is expected to inflate to 3.5% of GDP in 2017-2019, in part due to the depreciation of the Georgian lari and the high level of dollarisation of Georgia's external debt. External government debt is expected to peak at 43% of GDP in 2018.
The country's high current account deficit, which reached 13% of GDP at end-2016, is one of the important sources of external debt.
7.0 FX
Georgia's currency volatility not driven by fundamentals central bank says
No fundamental macroeconomic factors stand behind the volatility of Georgia’s currency, vice-president of the National Bank of Georgia Murtaz Kikoria said on October 16. The currency had lost 3% versus the euro over the previous week.
The Georgian lari has been particularly volatile across this year, but after a period of weakening that started in early August it returned to where it was at
Georgia - Foreign exchange rate
2011
2012
2013
2014
2015
2016
2017
2018 Q1
2018 Q2
Currency (units per EUR) (average)
2.347
2.123
2.209
2.346
2.520
2.617
2.832
3.011
2.870
Currency (units per USD) (average)
1.686
1.651
1.663
1.766
2.270
2.367
2.509
2.442
2.458
30 GEORGIA Country Report November 2018 www.intellinews.com
