
Page 8 - Outlookspring2019
P. 8
OANNUAL RTEPOLRT 2O019 OK
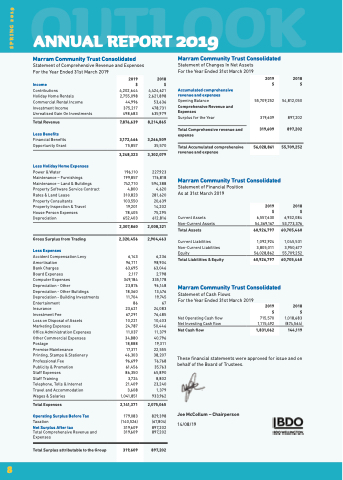
Marram Community Trust Consolidated
Statement of Comprehensive Revenue and Expenses For the Year Ended 31st March 2019
2018 Income $ Contributions 4,424,621
Marram Community Trust Consolidated
Statement of Changes In Net Assets For the Year Ended 31st March 2019
Accumulated comprehensive revenue and expenses Opening Balance Comprehensive Revenue and Expenses
Surplus for the Year
Total Comprehensive revenue and expense
Total Accumulated comprehensive revenue and expense
2018 $
54,812,050 897,202
897,202
55,709,252
2018 $ 6,932,084 53,773,376
60,705,460
1,045,531
3,950,677 55,709,252
60,705,460
2018 $ 1,018,683 (874,564)
144,119
2019 $
55,709,252
319,609
319,609
56,028,861
Holiday Home Rentals Commercial Rental Income Investment Income
Unrealised Gain On Investments
Total Revenue
Less Benefits
Financial Benefits Opportunity Grant
Less Holiday Home Expenses
Power & Water
Maintenance – Furnishings Maintenance – Land & Buildings Property Software Service Contract Rates & Land Lease
Property Consultants
Property Inspection & Travel
House Person Expenses Depreciation
Gross Surplus from Trading
Less Expenses
Accident Compensation Levy Amortisation
Bank Charges
Board Expenses
Computer Expenses
Depreciation - Other
Depreciation - Other Buildings Depreciation - Building Investments Entertainment
Insurance
Investment Fee
Loss on Disposal of Assets Marketing Expenses
Office Administration Expenses Other Commercial Expenses Postage
Premise Maintenance
Printing, Stamps & Stationery Professional Fee
Publicity & Promotion
Staff Expenses
Staff Training
Telephone, Tolls & Internet Travel and Accommodation Wages & Salaries
Total Expenses
Operating Surplus Before Tax
Taxation
Net Surplus After tax
Total Comprehensive Revenue and Expenses
2,621,898 53,636 478,731 635,979
8,214,865 3,266,509
35,570
3,302,079
227,923 176,818 594,388 4,620 281,620 20,639 14,202 75,295 612,816
2,008,321
2,904,463
6,236 98,904 63,046
2,798 335,178 96,148 13,476 19,745 67 24,083 76,485 10,403 50,446 11,379 40,796 19,311 22,555 38,207 76,768 35,763 65,890 8,802 23,240 1,379 933,962
2,075,065
829,398 (67,804)
897,202 897,202
Marram Community Trust Consolidated
Statement of Financial Position As at 31st March 2019
Current Assets Non-Current Assets
Total Assets
Current Liabilities Non-Current Liabilities Equity
Total Liabilities & Equity
Marram Community Trust Consolidated
Statement of Cash Flows
For the Year Ended 31st March 2019
Net Operating Cash flow Net Investing Cash flow
Net Cash flow
2019 $ 6,557,630 54,369,167
60,926,797
1,092,924
3,805,011 56,028,862
60,926,797
2019 $ 715,570 1,115,492
1,831,062
8
2019 $ 4,202,644 2,755,098 44,996 375,217 498,683
7,876,639
3,172,466
75,857
3,248,323
196,110 199,857 742,710
4,800 310,823 103,550 19,201 78,405 652,403
2,307,860
2,320,456
6,143 96,711 63,695
2,117 349,184 23,876 18,360 11,704 86 23,621 67,291 10,221 24,787 11,037 34,880 18,888 17,371 46,303 96,699 61,456 86,350 3,724 21,409 3,608 1,041,851
2,141,371
179,083
(140,526)
319,609 319,609
319,609
These financial statements were approved for issue and on behalf of the Board of Trustees.
Joe McCollum – Chairperson
14/08/19
Total Surplus attributable to the Group
897,202
SPRING 2019
