
Page 181 - Zlapdash Studio Portfolio
P. 181
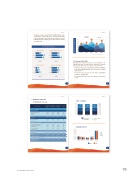
• The highest occupancy rate building, 68%, is IMPACT Exhibition Center,
as the number of event took place in this build had increased
to 30 events which 5 events from the new customers. The 2nd
is IMPACT Arena with occupancy rate at 59%, comes from Concert
and Family Show 52%
50% 48% 46% 44% 42%
(+10% YoY) (+7% QoQ)
1Q’15/16
(+9% YoY)
6M14/15 6M15/16
54%
52%
51%
49%
48%
46.64%
IMPACT ARENA
IMPACT EXHIBITION HALL 1-8
OCCUPANCY RATE (%)
2Q’14/15 36% 1Q’15/16
2Q’15/16
0% 20% 40%
(+64% YoY) (-3% QoQ)
61% 59%
2Q’14/15 1Q’15/16 2Q’15/16
2Q’14/15 1Q’15/16 2Q’15/16
57% 56%
2Q’14/15
2Q’15/16
Source : IMPACT Accounting & Finance Dept.
IMPACT FORUM
IMPACT CHALLENGER
68%
60%
80% 100%
80% 100%
0%
20%
40%
(+20% YoY) (+23% QoQ)
60% 80% 100%
3.2 Average Rental Rate
Average rental rate for the period of July - September is 62 baht/Sq.m./Day which 5% higher than the same period of last year but decreased 3% from the last quarter as the result from
• Proportion of private sector had increased from 39% in 2Q'2014/2015 to be 49% in 2Q'2015/2016 and most of them were in IMPACT Exhibition Center
• Government sector has decrease from 55% in 2Q'2014/2015 to 30% in 2Q'2015/2016
• The International Private Sector still maintain their proportion at 21%
56
2Q’14/15 12% 1Q’15/16 15% 2Q’15/16 22%
0% 20% 40%
(+83% YoY) (+46% QoQ)
60%
0%
20%
48% 50%
46%
40% 60% 80% 100%
(-5% YoY) (-9% QoQ)
4. FINANCIAL HIGHLIGHT
4.1 Statement of Income
DEPT COVENANT
7.33
2.81
6.63
6.67
19%
3.13 19%
3.14
19%
ปี 2557/2558 1Q’2558/2559 2Q’2558/2559
8 7 6 5 4 3 2 1 0
20% 18% 16% 14% 12% 10% 8% 6% 4% 2% 0%
Interest Coverge DSCR
รายการ (ล้านบาท)
P&L รายได้จากการลงทุน
รายได้จากการให้บริการพืนท่ี รายได้ดอกเบีย
รายได้อ่นื
รวมรายได้
ค่าใช้จ่าย
ต้นทุนการให้บริการพืนท่ี
ค่าใชจ่ายในการบริหาร
รวมค่าใช้จ่ายในการดําเนินธุรกิจ
ค่าธรรมเนียมผู้บริหารอสังหาริมทรัพย์ 22.36 15.23 ค่าธรรมเนียมผู้จัดการกองทรัสต์ 112.84 29.09
ค่าธรรมเนียมทรัสตี 31.87 15.29 ค่าธรรมเนียมนายทะเบียน 1.89 0.90
ส้ินสุด มีนาคม 2558
1,114.259
สิ้นสุด มิถุนายน ส้ินสุด กันยายน GROWTH
2558 QoQ
500.32 1%
0.236 -14% 2.867 0.617 5.655 817%
2558
498.263
1,109.731 1.661
497.373 0.273
506.209 2%
73.26 3% 48.94 -11% 122.20 -3% 15.61 2% 39.08 34% 15.42 1% 0.90 0%
FY2014/2015
1Q’2015/2016
Debt/total asset Debt/EBITDA
2Q’2015/2016
150.63 66.01 216.65
70.85 54.77 125.61
ค่าธรรมเนียมวิชาขีพ
รวมค่าธรรมเนียม
ต้นทุนทางการเงิน
รวมค่าใช้จ่าย
รายได้จากการลงทุนสุทธิ
2.32 1.11
171.29 61.61
98.46 46.92
486.40 234.15
0.71 -36% 0.900
71.72 16%
46.59 -1%
240.51 3%
1% 0.300
0.786
Since Inception
DPU
DIVIDEND PAYOUT
0.800 0.700 0.600 0.500 0.400
96% Dividend Payout
0.775
0.235 0.230
0.191 0.190 0.179 0.175 0.180 0.180
627.86
3.92
รายการกําไรสุทธิท่ยีังไม่เกิดขึนจากการลงทุน -20% 0.200 0.100 0.000
การเพ่ิมขึ้นในสินทรัพย์สุทธิ 631.78 266.10 267.29 0% จากการดําเนินงาน
264.12
1.98
265.70
1.59
3Q’2014/15
4Q’2014/15
1Q’2015/16
2Q’2015/16
EPS
8 11
ZLAPDASH STUDIO 0181
AVERAGE OCCUPANY RATE
