
Page 16 - 2025 Housing Forecast
P. 16
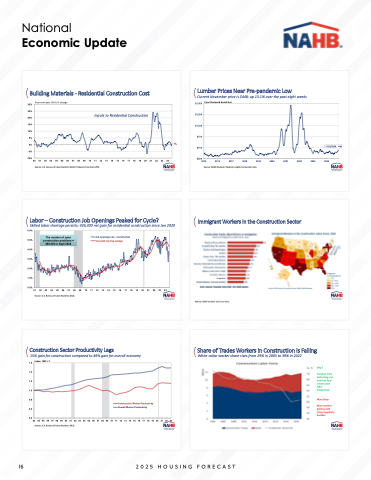
  Building Materials - Residential Construction Cost
Year-over-year (YoY) % change
30% 25% 20% 15% 10%
5% 0% -5% -10%
1%
   Inputs to Residential Construction
                      00 01 02 03 04 05 06 07 08 09 10 11 12 13 14 15 16 17 18 19 20 21 22 23 24
Source: U.S. Bureau of Labor Statistics (BLS): Producer Price Index (PPI)
  Lumber Prices Near Pre-pandemic Low
Current November price is $448; up 13.1% over the past eight weeks
$1,550 $ per thousand board feet $1,290
$1,030 $770 $510 $250
2015 2016 2017 2018 2019 2020
Source: NAHB Analysis; Random Lengths Composite Index
48
    11/22/2024, 4
             2021 2022 2023 2024
  Labor – Construction Job Openings Peaked for Cycle?
Skilled labor shortage persists; 426,300 net gain for residential construction since Jan 2020
6.0%
5.0% construction positions =
Job openings rate - Construction
12-month moving average
1.00 0.90 0.80 0.70 0.60 0.50 0.40 0.30 0.20 0.10 -
   4.0% 3.0% 2.0% 1.0% 0.0%
01 02 03 04 05 06 07 08 09 10 11 12 13 14 15 16 17 18 19 20 21 22 23 24
Source: U.S. Bureau of Labor Statistics (BLS).
The number of open 288,000 in Sept 2024
        Immigrant Workers in the Construction Sector
 Source: NAHB analysis of Census data
   Construction Sector Productivity Lags
15% gain for construction compared to 49% gain for overall economy
1.6 1.4 1.2 1.0 0.8 0.6 0.4
Index, 1993 = 1
93 94 95 96 97 98 99 00 01 02 03 04 05 06 07 08 09 10 11 12 13 14 15 16 17 18 19 20 21 22 23
Source: U.S. Bureau of Labor Statistics (BLS).
 Construction Worker Productivity
Overall Worker Productivity
         Share of Trades Workers in Construction is Falling White-collar worker share rises from 29% in 2005 to 39% in 2022
Why?
Could be more technology use and thus help construction labor productivity
More likely:
More workers dealing with rising regulatory burdens
           National
Economic Update
  16 2025 HOUSING FORECAST
