
Page 30 - Builder Brief May 2021 Issue
P. 30
HOUSING AFFORDABILITY
MINORITY HOUSEHOLDS FACE HOUSING AFFORDABILITY CHALLENGES
Originally published at nahbnow.com
New NAHB analysis on housing affordability based on race and ethnicity shows a wide disparity regarding the number of households that can afford a new median priced home.
At the national level, the share of Black households that are able to afford a new home is substantially lower than the share of non-Hispanic white households. Only 24% of Black households are able to afford the median new U.S. price of $346,577. Among non-Hispanic white households, 44% have sufficient income to qualify for a mortgage for a new median priced home under standard underwriting criteria, compared to 56% of Asian households and 32% of Hispanic households.
The number of households being priced out of the market because of a $1,000 price increase varies among different racial/ethnic groups, but is more or less proportional to population size. The largest priced-out number as a result of a $1,000 price increase is 106,278 for non-Hispanic white
households, which accounts for around 67% of total U.S. households. By contrast, the number of Black and Hispanic households that would be priced out the market because of a $1,000 price hike are 15,840 and 21,376, respectively.
The affordability gap between non-Hispanic white households and minority households is persistent across all states, and is reflected by broad wage disparities. According to the 2019 American Community Survey, the median household income for non-Hispanic white households was $71,664, significantly higher than the $43,862 median household income for Black households.
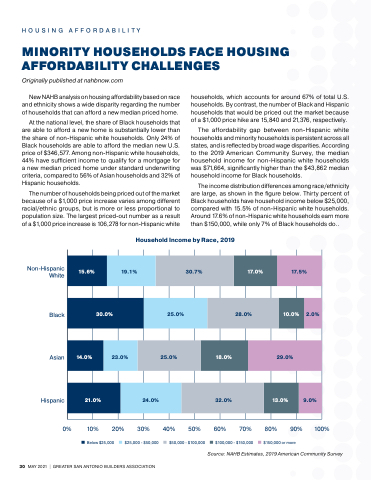
The income distribution differences among race/ethnicity are large, as shown in the figure below. Thirty percent of Black households have household income below $25,000, compared with 15.5% of non-Hispanic white households. Around 17.6% of non-Hispanic white households earn more than $150,000, while only 7% of Black households do..
Household Income by Race, 2019
15.6%
19.1%
30.7%
17.0%
17.5%
30.0%
25.0%
28.0%
10.0%
2.0%
14.0%
23.0%
25.0%
18.0%
29.0%
21.0%
24.0%
32.0%
13.0%
9.0%
Non-Hispanic White
Black
Asian
Hispanic
0% 10%
20% 30% 40%
50%
60% 70%
$100,000 - $150,000
80% 90% 100%
$150,000 or more
Below $25,000
$25,000 - $50,000
$50,000 - $100,000
30 MAY 2021 | GREATER SAN ANTONIO BUILDERS ASSOCIATION
Source: NAHB Estimates, 2019 American Community Survey
