
Page 28 - Builder Brief June 2026 Issue
P. 28
T R E N D S
IS THE DECLINE IN YOUNG ADULT-LED
HOUSEHOLDS A CYCLICAL SLIP OR THE NEW
NORMAL?
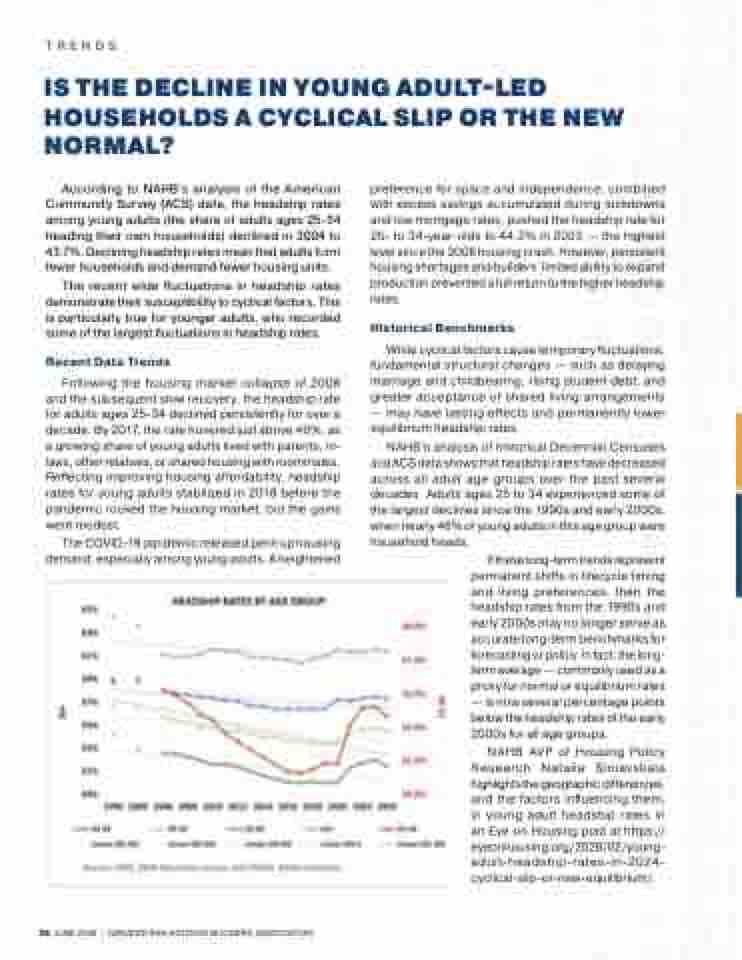
According to NAHB’s analysis of the American
Community Survey (ACS) data, the headship rates
among young adults (the share of adults ages 25-34
heading their own households) declined in 2024 to
43.7%. Declining headship rates mean that adults form
fewer households and demand fewer housing units.
The recent wide fluctuations in headship rates
demonstrate their susceptibility to cyclical factors. This
is particularly true for younger adults, who recorded
some of the largest fluctuations in headship rates.
Recent Data Trends
Following the housing market collapse of 2008
and the subsequent slow recovery, the headship rate
for adults ages 25-34 declined persistently for over a
decade. By 2017, the rate hovered just above 40%, as
a growing share of young adults lived with parents, in-
laws, other relatives, or shared housing with roommates.
Reflecting improving housing affordability, headship
rates for young adults stabilized in 2018 before the
pandemic rocked the housing market, but the gains
were modest.
The COVID-19 pandemic released pent-up housing
demand, especially among young adults. A heightened
preference for space and independence, combined
with excess savings accumulated during lockdowns
and low mortgage rates, pushed the headship rate for
25- to 34-year-olds to 44.2% in 2023 — the highest
level since the 2008 housing crash. However, persistent
housing shortages and builders’ limited ability to expand
production prevented a full return to the higher headship
rates.
Historical Benchmarks
While cyclical factors cause temporary fluctuations,
fundamental structural changes — such as delaying
marriage and childbearing, rising student debt, and
greater acceptance of shared living arrangements
— may have lasting effects and permanently lower
equilibrium headship rates.
NAHB’s analysis of historical Decennial Censuses
and ACS data shows that headship rates have decreased
across all adult age groups over the past several
decades. Adults ages 25 to 34 experienced some of
the largest declines since the 1990s and early 2000s,
when nearly 46% of young adults in this age group were
household heads.
If these long-term trends represent
permanent shifts in lifecycle timing
and living preferences, then the
headship rates from the 1990s and
early 2000s may no longer serve as
accurate long-term benchmarks for
forecasting or policy. In fact, the long-
term average — commonly used as a
proxy for normal or equilibrium rates
— is now several percentage points
below the headship rates of the early
2000s for all age groups.
NAHB AVP of Housing Policy
Research Natalia Siniavskaia
highlights the geographic differences,
and the factors influencing them,
in young adult headship rates in
an Eye on Housing post at https://
eyeonhousing.org/2026/02/young-
adult-headship-rates-in-2024-
cyclical-slip-or-new-equilibrium/.
28 JUNE 2026 | GREATER SAN ANTONIO BUILDERS ASSOCIATION
