
Page 12 - PFAR Report 2022
P. 12
Grants $ 3 576 681
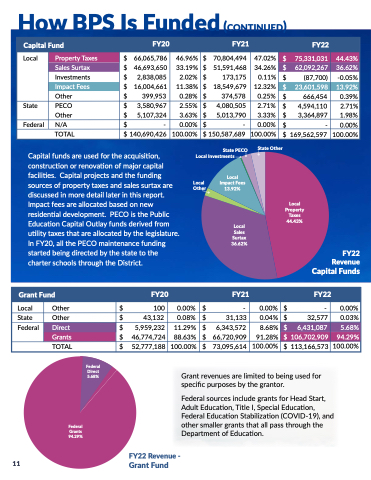
How BPS Is Funded (continued)
Debt Services
FY21
FY22
64 -
310 687
Local
11 State
Investments Other Other FY22
Revenue -
-
$ 0 0 02%
0 0 0 00% 99 98%
582 901 0 0 0 10% TOTAL
$ $ $ 567 312 097 100 100 100 00% 00% 00% $ $ $ 574 932 166 100 100 100 00% 00% 00% $ $ $ 558 203 799 100 100 100 00% 00% 00% Food Services
$ $ $ 347 188 1 1 1 02%
$ $ $ 332 332 807 0 0 0 82% $ $ $ 332 332 919
Food Services
TOTAL
Federal sources include grants for Head Start $ $ $ 26 355 335 77A 5d2u%lt E$duc3a6ti 6o6n6 T86it2le I I 9S0p e1c6i%al E$duc4a9ti 1o8n5 707
Federal Grants 94 29% other smaller grants that all all pass through the the 90 63% $ $ $ 41 112 0 0 0 0 0 12% $ $ $ 285 232
0 0 0 0 0 70% $ $ $ 383 800
0 71%
0 61%
90 63% FY20
$ 133 368
Department of Education $ $ -
-
0 0 0 00% $ $ Grant Fund $ $ 342 045 71 95% $ $ 0 0 0 63% $ 4 068 023
State
Federal Education StabilizOathtieron (COVID-19) and
$ $ $ 33 996 189 100 100 100 00% 00% 00% $ $ $ 40 668 702 100 100 100 00% 00% 00% $ $ $ 54 270 943 100 100 100 00% 00% 00% 28 05% $ 46 0 0 01%
-
0 0 0 00% $ 311 712 99 99 99% $ 0 71%
$ 99 98%
Capital Fund FY20
FY21
FY22
Local
General Local
Property Taxes
$ 66 065 786 $ 46 693 650
$ $ 2 2 2 2 838 085
$ $ $ 200 038 732
$ $ 16 004 661
$ $ $ 1 1 1 852 722
$ 399 953
FY20
46 96%
33 19%
2 2 02%
35 61%
11 38%
0 0 33%
0 0 28% $ 70 804 494 $ 51 591 468
$ $ 173 175
$ $ $ 209 714 803
$ $ $ 18 549 679
$ $ $ 120 058
$ $ $ 374 578
FY21
47 02%
34 26%
0 11%
36 48%
12 32%
0 0 0 02%
0 0 0 25%
$ 75
331 031
44 43%
Sales
Surtax und $ 62 092 267
FY22
36 62%
Investments $ $ (87 700)
-0 05% Impact Fees
$ $ $ 23 601 598
13 92%
Other Other $ $ $ 666 454
0 0 0 39%
State
State
State
State
PECO
FEFP Other $ $ $ 9 9 9 9 9 575 351
$ 3 3 580 967
$ $ $ 258 418 786 $ $ 5 5 107 324
1 69%
2 55%
55%
45 55%
55%
3 3 63% $ $ $ 11 171 486
$ $ $ 4 4 4 4 080 505
$ $ $ 262 434 270 $ $ $ 5 013 790
1 1 94%
2 71%
45 65%
3 3 3 3 3 33%
33%
$ $ $ 4 4 4 4 4 594 110
$ $ $ 247 370 180
$ $ $ 3 3 3 364 897
2 2 2 71%
44 32%
1 1 98%
Federal Categoricals
N/A
$$ 86 062 876-
15 17%
0 0 0 0 00% $ $ $ 82 404 103
$-
14 33%
33%
0 0 0 0 00% $ $ $ 74 694 118
$-
13 38%
0 0 0 0 00% Other (Includes
TOTAL
$ $ $ 5 5 191 854
$ 140 690 426
0 0 0 0 0 0 0 0 92%
100 00% $ $ $ 4 250 031
$ $ $ 150 587 689
0 0 0 0 0 0 0 74%
100 00% $ $ $ 4 4 354 035
$ $ $ 169 562 597
0 0 0 0 0 0 0 0 78%
100 00% Federal Direct
Grants State
0 0 0 0 0 11%
$ $ 558 203 799 100 00% 00% F Property Taxes
Investments Other Other $ $ $ $ $ $ $ $ $ 218 505
036
275 424 11 11 804 451
39 15%
0 0 0 05% 2 2 11%
13 38%
13 92%
Local
$ $ Investments 595 095 0 0 0 0 0 0 10% $ $ State
Other discussedGirnanmtsore detail later i$n th4is6 r7e7p4o 7rt2 4 4 4 4 88 63% $ $ $ $ $ $ 66 720 909 91 28% $ $ 106 702 909 94 29% Local
Local
PropertyTaxes $ $ $ 66 065 786 46 96%
Local
$ $ $ 70 804 494 47 02%
$ $ $ 75
331 031
44 43%
Impact feTeOsTaAreL allocated base$d on5P2rno 7epe7wrt7y 188 100 00% SalesSurtax $ $ 46 693 650
33 19%
$ $ $ 73 095 614 100 00% $ $ $ 113 166 573 100 00% residential development PECO
is the Public
utility taxes that are allocated by the the legislature $ 23 601 598
13 92%
Local
OFtohoedr Sales
$$ State
State
POECthOer FEFP $$ $$ $$ $$ 3 3 3 3 3 3 5804 19
61712 20 20 5 5 5 5 152%% $$ $$ $$ $$ 73 92952 9 9 9 5534 201 2 2 2 2 383%% $$ In FY20
all all the the the the PECOSmtatae intenance funding
3 3 3 3 3 7348 35 78801 0 0 82 53%2% Surtax $ $ 4 4 4 368
517
8 8 05% started being directed by the the the the state to to the the the the 4 08208 5 5 20352 2 2 2 2 2 07 17%0% 5 0133 27 8907 3 3 3 3 3 03 38%2% 36 666 86-2 09 0 0 0 016%%
FY22
State
OFtohoedr Services44 32%
$$ 5 10374 73 21488 31 6 032%% $$ $ $ 3 3 3 33624 981997 01 01 6918% Revenue charter schools through the the District Federal $ 49 185 707- 90 6030% Capital Funds
FeFdeedrearlal NF/oAod Services
$$ $$ 26 355 33-5 707
0 0 0 502%% $$ $$ 769 392
$ $ $ 3 3 3 576 681
0 0 0 0 0 63% $ $ $ 4 0S6ta8te 0P2EC3O 0 0 0 0 0 71%
$ $ $ Federal Grant Grant Grant Fund Grants Grants FY20
FY21
FY22
Capital funds areOtuhsered for the acquisition Local
Investments Investments TOTAL
$ $ $ $ 567 312 097 100 100 100 00% 00% 00% 00% $ $ $ $ 574 932 166 100 100 100 00% 00% 00% 00% TOTOTATALL $$1403 36 909 64 21L68oc9al11000 0 0 0 0 0 0 0 0 00%% Other $$1504 05 8676 86 86 87902 11000 0 0 0 0 0 0 0 0 0 00%% $ $ 16594 526720 599473 100 00% Taxes
Property Taxes
23 893 185% 085
2 2 2 2 02%
FoEodducSaetirovniceCsapitalOutlayfundsderivedFfrYo2m0 FY21
FY22
Investments $ Impact Fees
$ 16 004 661
11 38%
$ 18 549 L6o7ca9l 12 32%
Sales
$ $ 44 43%
(87 700)
-0 05% Direct
$ $ 51 591 468
34 26%
$ 173 175
0 11%
$ $ 62 62 092 267
36 62%
36 62%
$ $ 666 454
0 0 39%
$$ 4 4 358934 81010 02 71%
0 0 0 0 13% $ $ 617 654 582 901 0 0 0 10% construction or or or renovation of major capital
Local
Other $ $ facilities Capital Capital projects and$the fun4d3in 1g32 0 0 0 0 0 0 0 0 08% $ $ $ $ 31 133 0 0 04%
$ $ $ $ -
0 0 0 0 0 0 0 00% 00% 32
577 0 0 03%
State
State
Other State
State
Fesdoeurarcl es es es es es oDf iprercotpCeartetgyorticaaxlses and
and
$sales5s 9u5r9ta 2x3a2re 11 29% $ $ $ $ Local
Impact Fees
Capital Capital Fund FY20
Local
FY21
FY22
1000 00%$
-
0 0 0 0 0 0 0 00% 00% Other 6 6 343 572
8 8 68% 6 6 431 087
5 68% Local
Y22
Revenue Grant Fund FY20
FY20
FY21
FY21
FY22
FY22
FY22
Debt Services
FY20
FY20
FY21
FY21
FY22
FY22
Local
Local
Local
Local
Other Investments $ $ 100 $ $ 133 368
0 0 0 0 00% 28 05% $-
$ $ $ 46 FY22
Re 0 0 0 0 0 00% 0 0 0 0 0 0 0 01%
venue -
Debt S $-
$ $ $ 64 ervices
0 0 0 0 0 00% 0 0 0 0 0 0 0 02%
F State
Other Other Other Other $$ 43 132-
0 0 0 0 0 0 08% 0 0 0 0 0 00% $ $ $ 31 133 $-
0 0 0 0 0 0 0 04%
0 0 0 0 0 00% $ $ $ 32
577 $-
0 0 0 0 0 0 0 03%
0 0 0 0 0 00% Federal State
Federal Direct
Other Fo Local
$ $ $ 5 5 5 959 232
$ 342 045 od Sales
8 $05% 46 774 724 $-
11 29% 71 95% 88 63% 0 0 0 0 0 0 00% 00% $ $ $ 6 343 572
$ $ $ 311 712 $ $ $ 66 720 909 $-
8 8 68% 99 99 99% 91 28% 0 0 0 0 0 0 00% 00% $ $ $ 6 6 431 087
$ $ $ 310 687
5 68% 99 98%
Grants N/A
$ $ $ 106 702 909 $-
94 29% 0 0 0 0 0 0 0 00% 00% TOFYT22ARLevenue-GrantFunds TOTAL
$ $ $ 52 777 188 $ 475 413
100 100 00% 00% 00% 100 100 00% 00% $ $ $ 73 095 614 $ $ 311 758 100 100 00% 00% 00% 100 100 00% 00% $ $ $ 113 166 573 $ $ 310 751 100 100 00% 00% 00% 100 100 00% 00% FY22
Revenue -
Food Services
Food Services
Federal Direct
5 68% FY20
FY21
FY22
Local
State
Federal Grant revenues are limited to to being used for 8 05% Food Sales
$ $ 7 252 554 21
33%
$ $ 3 3 3 3 3 3 383 801 8 8 8 32%
$ 4 368
517
Capital Funds
Federal Other Food Services
specific purposes by the grantor 