
Page 22 - PFAR Report 2022
P. 22
Property Taxes
21 Property taxes taxes taxes are locally assessed taxes taxes taxes on on residential and and business real estate The taxes taxes taxes The The Florida Legislature sets the millage millage rate rate rate or or or rate rate rate of of taxation for schools The The millage millage rate rate rate is is fund community agencies and and services including
1/10 of of of a a a a a a a a a a a a a cent or or one one dollar dollar per one one thousand
Top ten taxpayers for tax tax year 2021
Rank Taxpayer Name
1 Florida Power & Light Company
2 L3 Harris Technologies
3 Walmart Stores Inc 4 City of Melbourne Airport Authority
5 Steward LLC
6 Health First Physicians Real & Estate LLC
7 Plant Oleander Power Project Ltd
8 Publix Super Markets Inc 9 Canaveral Port Authority
10 Florida East Coast Railway LLC
*Total assessed value for tax tax year 2021
- all taxpayers FY22 Long Term Debt
Balance 06/30/22 Due in One Year
Certificates of Participation
$ $ 355 281 483 $ $ 25 328 653
Bonds
$ $ 701 220 $ $ 339 667
education The Brevard County Property dollars of of o taxable value The Brevard County Tax Appraiser’s office sets the value o of of each piece
Collector’s office collects property taxes less any
o of of property located within Brevard County allowable exemptions for Brevard County Estimated Claims
$ $ 18 911 896 $ $ 8 8 8 769 457 Compensated Absences
$ $ 41 179 007 $ $ 3 868 448
Other Postemployment Benefits $ $ 17 17 301 117 $ $ - Net Pension Liability $ $ 190 858 173 $ $ - Property Tax Levies and Collections – Last Ten Years
(a) Taxable value value equals assessed value value less exemptions Source: Brevard Public Schools Comprehensive Annual Report for the year ended June 30 2020
TOTAL $ $ 624 238 896 $ $ 38
38
306 225 Highest Taxable Value (a) $ 23 989 446
$ 4 4 021
642
$ 3 565 740
$ 2 676 194
$ 2 009 464
$ 1 827 522
$ 1 1 600 019 $ 1 225 847
$ 1 1 1 161 285
$ 1 1 155 243
$ 43
232 402
% of Total Asessed Value*
0 0 0462%
0 0 0 0077%
0 0 0 0069%
0 0 0 0052%
0 0 0 0039%
0 0 0 0035%
0 0 0 0031%
0 0 0 0024%
0 0 0 0022%
0 0 0 0022%
0 0 0883%
$ 51 930 424 822 High Quality
Upper Medium
Medium
Grade
Speculative
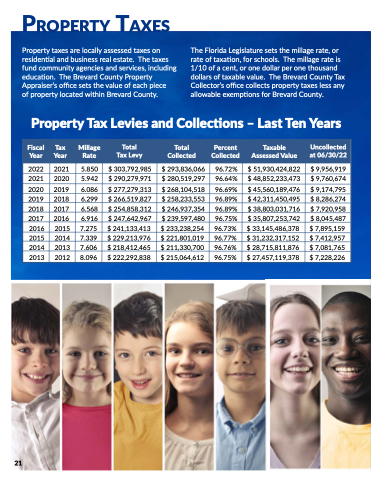
Fiscal Tax Tax Tax Millage Total Total Total Total Percent Taxable Uncollected Year
Year
Year
Year
Rate Tax Tax Tax Levy Collected Collected Collected Collected Assessed Value at at 06/30/22 2022
2021
5 5 850
$ 303 792 985
$ 293 836 066
96 72%
$ 51 930 424 822 $ 9 9 9 9 956 919
2021
2020
5 942
$ 290 279 971
$ 280 519 297
96 64%
$ 48 852 233 473
$ 9 760 674
2020
2019
6 6 086
$ 277 279 313
$ 268 104 518
96 69%
$ 45 560 189 476
$ 9 9 174 795
2019
2018
6 299
$ 266 519 827 $ 258 233 553
96 89%
$ 42
311 450 495
$ 8 8 286 274
2018
2017
6 6 568
$ 254 858 312
$ 246 937 354
96 89%
$ 38
803 031 716
$ 7 920 958
2017
2016 6 6 916
$ 247 642
967
$ 239 597 480
96 75% $ 35 807 253 742
$ 8 8 045 487
2016 2015 7 7 275 $ 241 133 413 $ 233 238 254 96 73% $ 33 145 486 378 $ 7 895 159 2015 2014 7 339 $ 229 213 976 $ 221 801 019 96 77% $ 31 31 232 317 152 $ 7 7 412 957 2014 2013 7 606 $ 218 412 465 $ 211 330 700 96 76% $ 28 715 811 876 $ 7 7 081 765 2013 2012
8 096 $ 222 292 838
$ 215 064 612
96 75% $ 27 457 119 378 $ 7 228 226
