
Page 48 - Sites - May 17 Issue
P. 48
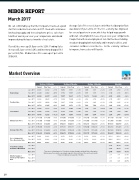
MIBOR REPORT
March 2017
We can comfortably say that the  rst quarter has been a good startforresidentialrealestatein2017. Evenwithcontinuous low housing supply and increasing home prices, sales have held their own in year-over-year comparisons and should improve during the busiest months of real estate.
ClosedSaleswereup20.5percentto3,206.PendingSales increased 5.2 percent to 3,283, and Inventory dropped 16.6 percentto8,746. MedianSalesPricewasup4.9percentto $156,000.
Average Sales Price rose 4.0 percent in March. Absorption Rate wasdown23.7percentto2.9.TheU.S.economyhasimproved for several quarters in a row, which has helped wage growth and retail consumption increase in year-over-year comparisons. Couple that with an unemployment rate that has been holding steady or dropping both nationally and in many localities, and consumercon denceisontherise. Astheeconomycontinues to improve, home sales will  ourish.
48
Market Overview
Key market metrics for the current month as well as for rolling segments in which the given value represents 3, 6 or 12 months of activity.
Jan 2017 Pending Sales Feb 2017 Mar 2017
Rolling 12 Months
Current Prior Year + / –
32,436 30,681 32,541 30,982 32,702 31,425
+ 5.7% + 5.0% + 4.1%
Rolling 6 Months
Current Prior Year + / –
14,328 13,960 13,817 13,740 14,405 14,170
+ 2.6% + 0.6% + 1.7%
7,208 7,585 10,013
7,121 + 1.2% 7,673 - 1.1% 10,048 - 0.3%
Rolling 3 Months
Current Prior Year + / –
Monthly
Current Prior Year + / –
Jan 2017 New Listings Feb 2017 Mar 2017
43,446 42,722 43,420 43,022 43,382 43,377
+ 1.7% + 0.9% + 0.0%
18,094 17,861 17,182 17,069 17,877 18,007
+ 1.3% + 0.7% - 0.7%
2,581 2,552 3,120 3,146 4,312 4,350
+ 1.1% - 0.8% - 0.9%
6,186 6,133 6,612 6,425 7,982 7,604
+ 0.9% + 2.9% + 5.0%
2,149 2,037 2,550 2,445 3,283 3,122
+ 5.5% + 4.3% + 5.2%
Jan 2017 Closed Sales Feb 2017 Mar 2017
35,509 32,321 35,509 32,495 36,055 32,720
+ 9.9% + 9.3% + 10.2%
16,652 15,004 15,244 13,984 15,254 13,857
+ 11.0% + 9.0% + 10.1%
7,220 6,541 6,555 6,368 6,996 6,374
+ 10.4% + 2.9% + 9.8%
1,806 1,730 1,984 1,984 3,206 2,660
+ 4.4% 0.0% + 20.5%
Jan 2017 Median Sales Price Feb 2017 Mar 2017
Jan 2017 Average Sales Price Feb 2017 Mar 2017
Pct. of Original List Price Received at Sale
Jan 2017 Feb 2017 Mar 2017
$154,500 $155,000 $155,000
$147,900 $148,000 $148,263
+ 4.5% + 4.7% + 4.5%
$190,608 $191,596 $192,091
$183,947 $184,076 $184,508
+ 3.6% + 4.1% + 4.1%
$154,000 $153,500 $152,900
$145,000 $142,000 $142,500
+ 6.2% + 8.1% + 7.3%
$191,655 $191,055 $189,272
$181,691 $178,550 $178,668
+ 5.5% + 7.0% + 5.9%
$150,100 $150,000 $152,000
$142,000 $139,900 $142,000
+ 5.7% + 7.2% + 7.0%
$190,600 $189,191 $187,137
$180,625 $176,205 $175,620
+ 5.5% + 7.4% + 6.6%
93.9% 92.9% 93.7% 92.9% 94.2% 93.3%
+ 1.1% + 0.9% + 1.0%
$143,700 $152,000 $156,000
$137,500 $135,000 $148,750
+ 4.5% + 12.6% + 4.9%
$182,552 $187,893 $189,237
$172,016 $170,125 $182,023
+ 6.1% + 10.4% + 4.0%
94.8% 93.8%
94.9% 93.8%
94.9% 93.9%
+ 1.1% + 1.2% + 1.1%
94.5% 93.5% 94.2% 93.2% 94.2% 93.2%
+ 1.1% + 1.1% + 1.1%
93.5% 92.9% 94.0% 92.9% 94.8% 93.9%
+ 0.6% + 1.2% + 1.0%
Jan 2017 Available at Month End Feb 2017 Mar 2017
Total Active Listings
There are no rolling figures for Total Active Listings Available at Month End or Absorption Rate because these metrics are simply snapshots frozen in time at the end of each month. It does not add up over a period of months.
8,668 10,186 8,489 10,255 8,746 10,490
- 14.9% - 17.2% - 16.6%
Months Supply of
Inventory / Absorption Feb 2017
Rate
Mar 2017
Jan 2017
2.9 3.8 2.9 3.8 2.9 3.8
- 23.7% - 23.7% - 23.7%
Data obtained from the Broker Listing Cooperative® (BLC®). Report format © 2017 ShowingTime. | 2
