
Page 22 - Demo
P. 22
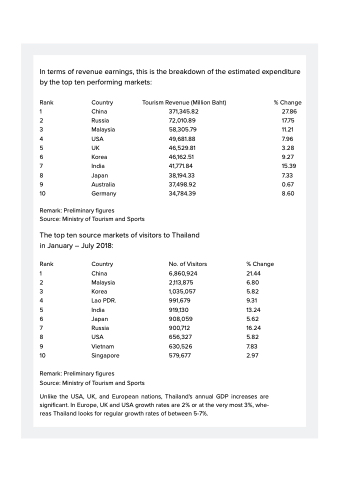
 In terms of revenue earnings, this is the breakdown of the estimated expenditure by the top ten performing markets:
Rank Country
1 China
2 Russia
3 Malaysia
4 USA
5 UK
6 Korea
7 India
8 Japan
9 Australia
10 Germany
Remark: Preliminary figures
Source: Ministry of Tourism and Sports
The top ten source markets of visitors to Thailand in January – July 2018:
Rank Country
1 China
2 Malaysia
3 Korea
4 Lao PDR.
5 India
6 Japan
7 Russia
8 USA
9 Vietnam
10 Singapore
Remark: Preliminary figures
Source: Ministry of Tourism and Sports
No. of Visitors 6,860,924 2,113,875 1,035,057 991,679 919,130 908,059 900,712 656,327 630,526 579,677
Tourism Revenue (Million Baht) 371,345.82
72,010.89 58,305.79 49,681.88 46,529.81 46,162.51 41,771.84 38,194.33 37,498.92 34,784.39
% Change 27.86
17.75 11.21 7.96 3.28 9.27 15.39 7.33 0.67 8.60
% Change 21.44 6.80
5.82
9.31 13.24 5.62 16.24 5.82 7.83 2.97
Unlike the USA, UK, and European nations, Thailand's annual GDP increases are significant. In Europe, UK and USA growth rates are 2% or at the very most 3%, whe- reas Thailand looks for regular growth rates of between 5-7%.
