
Page 101 - Loomis Annual Report 2017
P. 101
Loomis Annual Report 2017
Notes – Group 97
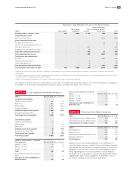
Shareholders’ equity attributable to the owners of the Parent Company
SEK m
Opening balance, January 1, 2017 Comprehensive income
Net income for the year
Other comprehensive income Actuarial gains and losses
Tax effect on actuarial gains and losses Translation differences
Hedging of net investments, net of tax Total other comprehensive income Total comprehensive income Transactions with shareholders Dividend
Share-based remuneration2)
Share swap agreement3)
Total transactions with shareholders Closing balance, December 31, 2017
Share capital
reserves1)
for the year
Total
Other capital contributed
Retained earnings Other including net income
376
4,594
1,131
546
6,647
–
–
–
1,428
1,428
–
–
–
20
20
–
–
–
–3
–3
–
–
–631
–
–631
–
–
179
–
179
–
–
–452
17
–435
–
–
–452
1,445
993
–
–
–
–602
–602
–
–
32
–
32
–
–
–33
–
–33
–
–
–1
–602
–603
376
4,594
678
1,389
7,037
1) Other reserves refers to translation differences, hedging of net investments net of tax, share-based remuneration, revaluation of contingent consideration and share swap agreement.
2) Includes the expensed portion of Loomis share-based incentive schemes in the statement of income, as described in Note 11. For 2016 the expensed portion was SEK 34 mil- lion and for 2017 the expensed portion was SEK 33 million.
3) Refers to swap agreement attributable to the Group’s share-based incentive scheme, as described on page 76.
The number of shares issued as of December 31, 2017 was 75,279,829 with a quotient value of 5. For more information on changes in the number of issued shares and distribution between Class A and Class B shares, refer to Note 51.
Dec. 31, 2017
35
82
-
117
NOTE 28
SEK m
Long-term loans payable
Liabilities, nancial leases
Bank loans
MTN program
Commercial papers
Subtotal long-term loans payable Derivatives and other items
Total long-term loans payable Current loans payable
Liabilities, nancial leases
MTN program
Bank loans
Subtotal current loans payable Derivatives and other items Total current loans payable Total loans payable
Liabilities, nancial leases – minimum lease payments
Maturity < 1 year Maturity 1–5 years Maturity >5 years Total
Future nancial expenses for nancial leases
Total present value of liabilities for nancial leases
Present value of liabilities for nancial leases
Maturity < 1 year
Maturity 1–5 years
Maturity >5 years
Total present value of liabilities for nancial leases
NOTE 29
SEK m
Long-term provisions for claims reserves Short-term provision for claims reserves Total provisions for claims reserves
SEK m
Opening balance
New provisions
Utilized amount and unutilized provisions Translation difference
Closing balance
Loans payable and nancial leases
Dec. 31, 2016
54 1,619 1,000 500 3,173 – 3,173
5 550 110 665 89 754 3,927
Dec. 31, 2016
5 57 – 62
–3
59
Dec. 31, 2016
20 39 –
59
Dec. 31, 2017
101
954
1,000
1,850
3,904
75
3,979
30
-
9
39
36
75
4,054
Provisions for claims reserves
Dec. 31, 2017
180
160
339
Dec. 31, 2016
209 195 405
Dec. 31, 2016
347
248 –210 20 405
Dec. 31, 2017
405
204
–237
–33
339
Dec. 31, 2017
31
107
-
138
-21
117
Claims reserves are calculated based on a combination of reported claims and incurred but not reported claims. Actuarial calculations are performed on a continuous basis to assess the adequacy of the reserves. There is a certain degree of uncer- tainty regarding dates for future payments. Considering this uncertainty, it is not possible to specify any detailed information regarding the date for future payments from Claims reserves. For further information refer to Note 2 and Note 4.
