
Page 124 - Loomis Annual Report 2017
P. 124
120 Five year overview
Loomis Annual Report 2017
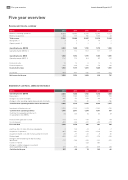
Five year overview
Revenue and income, summary
Revenue, continuing operations Revenue, acquisitions
Total revenue
Real growth, %
Organic growth, %
Operating income (EBITA)
Operating margin (EBITA), %
Operating income (EBIT)
Operating margin (EBIT), %
Financial income Financial expenses Income before taxes
Income tax
Net income for the year
Statement of cash ows, additional information Operating income (EBITA)
Depreciation
Change in accounts receivable
Change in other operating capital employed and other items Cash ow from operating activities before investments
Investments in xed assets, net
Cash ow from operating activities
Cash ow from operating activities as % of operating income (EBITA)
Financial items paid and received Income tax paid
Free cash ow
Cash ow effect of items affecting comparability Acquisition of operations
Acquisition-related costs and revenue, paid and received Dividend paid
Change in interest-bearing net debt excluding liquid funds
Issuance of bonds
Change in commercial papers issued and other long-term borrowing
Cash ow for the year
16,485 15,391 315 706
16,800 16,097
5 7 5 2
1,890 1,703
11.2 10.6
1,852 1,575
11.0 9.8
12 8 –129 –122 1,735 1,461
–477 –392
1,258 1,069
1,890 1,703
1,105 1,061 –53 –170 192 48
3,134 2,642
–1,120 –1,379
2,013 1,264
107 74
–117 –118 –326 –341
1,570 805
138 –14 –201 –279 –17 –52 –527 –451
–168 –258 – 549
–816 –225
–20 74
12,345 11,321 1,166 43
13,510 11,364
14 2 3 2
1,370 1,099
10.1 9.7
1,306 1,085
9.7 9.5
12 13 –79 –60 1,240 1,038
–330 –302
910 736
1,370 1,099
875 758 –40 6 –12 –186
2,194 1,677
–1,033 –720
1,161 957
85 87
–61 –49 –298 –319
803 590
–8 –7 –1,536 –29 –8 40 –376 –338
–333 –552 997 –
658 248
196 –48
SEK m
2017
16,824
404
2,093
2016
2015
2014
2013
17,228
3
2
12.1
1,992
11.6
13
–122
1,882
–454
1,428
SEK m
2017
2,093
1,124
–165
–145
2016
2015
2014
2013
2,908
–1,152
1,756
84
–111
–403
1,242
–467
–1
–80
–602
–117
231
–
207
