
Page 90 - Loomis Annual Report 2017
P. 90
86
Notes – Group
Loomis Annual Report 2017
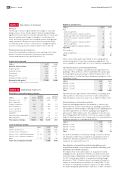
NOTE 9 Allocation of revenue
Revenue
The Group’s revenue is generated from a range of cash han- dling services. These include Cash in Transit and Cash Man- agement Services and cross border transportation of cash and precious metals and storage of valuables. Up until June 30, 2016, the Group’s revenue also included revenue from general cargo operations. Revenue is reported in the period in which
it is earned, as the service is executed on a straight-line basis over the contract period. For further details refer to Note 8.
Financial income and expenses
Interest income and borrowing costs are reported in the state- ment of income in the period to which they refer. Financial income and expenses are speci ed in Note 13.
Audit fees and other fees
SEK m
PwC
– Audit assignments
(whereof the parent company’s auditor)
– Auditing activities other than audit assignments
(whereof the parent company’s auditor)
– Tax advice
(whereof the parent company’s auditor)
– Other assignments
(wherof the parent company’s auditor)
Total PwC
Other auditors
– Audit assignments
Total
2016
13
(4)
1
(1)
0
(0)
0
(0)
15
1
16
2017
13
(4)
1
(1)
0
(0)
0
(0)
15
1
16
Organic and real growth
SEK m
Previous year’s revenue
Organic growth1)
Acquired revenue Divestments
Real growth
Change in foreign currency Revenue for the period
1) For de nition of organic growth, refer to page 76.
NOTE 10 Operating expenses Distribution of operating expenses by type
2016
16,097 731 315 –257 789 –86
16,800
as % of 2016 revenue
9,103 54.2 409 2.4
1,447 8.6 782 4.7
Other serives than audit relate mainly to accounting advice, technical statement of tax returns and value added tax. Ser- vices in addition to audit relate to no (no) statutory assignments.
Operational leases and rental agreements
Lease expenses relating to operational lease agreements for buildings, of ce premises, vehicles and machinery and equip- ment during the year amounted to SEK 415 million (397). The nominal value of contractual future minimum leasing fees is dis- tributed as follows:
SEK m 2016
Maturity < 1 year 402 Maturity 1–5 years 1,107 Maturity > 5 years 940 Total 2,448
Operational lease agreements refer primarily to buildings and of ce premises. The total cost for these in 2017 amounted to SEK 336 million (338), of the total cost of SEK 415 million (397).
Financial leases and rental contracts
Financial leasing agreements refer primarily to vehicles (pri- marily vehicles used for cash transport), buildings and techni- cal equipment. Paid leasing fees during the year regarding nan- cial lease agreements for vehicles, buildings and equipment amounted to SEK 19 million (21). The statement of income has been charged with SEK 2 million (1) for interest expenses attrib- utable to nancial leases. The nominal value of contractual future minimum leasing fees is distributed as follows:
2017
16,800
397
404
–239
562
–134
17,228
2017
476
1,408
797
2,680
2017
as % of revenue
9,439
54.8
331
1.9
1,506
8.7
822
4.8
713
4.1
–
–
2,426
14.1
15,236
88.4
SEK m
Personnel costs
Risk, claims and insurance expenses
Vehicle expenses
Costs of premises
Note
11
Costs of technical
equipment 713 4.2
Items affecting comparability Other expenses
Total expenses by type Costs of employee bene ts
SEK m
Salaries and bonuses
Social security contributions
Pension costs – de ned bene t plans
Pension costs – de ned contribution plans
Total costs of employee bene ts
–81 –0.5 2,574 15.3
14,947 89.0
Note 2016
11 7,354 11 1,553 11, 30 70
11, 30 126
9,103
SEK m
Maturity < 1 year Maturity 1–5 years Maturity > 5 years Total
2016
20 39 – 59
2017
40
91
–
130
2017
7,645
1,589
67
138
9,439
For further information on nancial leasing, see Notes 19 and 28. Translation differences included in operating income are immaterial. Translation differences in net nancial income/ expenses are reported in Note 13.
Amortization of acquisition-related intangible assets, acquisition-related costs revenue and items affecting com- parability classi ed by function
The table below shows amortization of acquisition-related intangible assets, acquisition-related costs and revenue and items affecting comparability classi ed by function. Earnings for 2017 include amortization of acquisition-related intangi-
ble assets of SEK –55 million which is included in Production expenses, and acquisition-related costs totaling SEK –47 mil- lion which is included in Production expenses of SEK –34 mil- lion and Selling and administrative expenses of SEK –13 million
