
Page 11 - Waitawheta Angus On Farm Female Sale 2020
P. 11
9
High 1% +12.3 High 5% +9.9 High 10% +8.5 High 15% +7.5 High 20% +6.6 High 25% +5.8 High 30% +5.0 High 35% +4.3 High 40% +3.5 High 45% +2.8 50% +2.1 Low 45% +1.4 Low 40% +0.7 Low 35% +0.0 Low 30% -0.9 Low 25% -1.8 Low 20% -2.8 Low 15% -4.0 Low 10% -5.6 Low 5% -8.1 Low 1% -13.2
-0.2 -3.1 +5.1 -0.9 -2.8 +5.3 -1.7 -2.5 +5.6 -2.8 -2.0 +5.9 -4.1 -1.5 +6.3 -6.0 -0.6 +6.9 -9.8 +1.3 +8.1
+63 +111 +57 +103 +55 +98 +53 +95 +52 +93 +51 +91 +50 +89 +49 +88 +48 +86 +47 +85 +46 +84 +45 +82 +44 +81 +43 +79 +42 +77 +41 +75 +40 +73 +38 +71 +36 +67 +32 +62 +26 +52
+150 +145 +27 +137 +129 +23 +130 +120 +22 +126 +115 +20 +123 +111 +20 +120 +108 +19 +118 +105 +18 +115 +102 +18 +113 +100 +17 +111 +97 +16 +109 +95 +16 +107 +92 +15 +105 +90 +15 +103 +88 +14 +100 +85 +14 +98 +82 +13 +95 +79 +12 +91 +75 +12 +86 +70 +11 +79 +62 +9 +65 +46 +6
+87 +11.3 +3.2 +79 +9.2 +2.1 +75 +8.2 +1.6 +72 +7.6 +1.3 +70 +7.1 +1.0 +68 +6.8 +0.8 +67 +6.4 +0.6 +65 +6.1 +0.5 +64 +5.8 +0.3 +63 +5.5 +0.2 +61 +5.2 +0.0 +60 +4.9 -0.1 +59 +4.7 -0.3 +57 +4.4 -0.4 +55 +4.1 -0.6 +53 +3.7 -0.8 +51 +3.3 -1.0 +48 +2.9 -1.2 +44 +2.3 -1.5 +37 +1.5 -1.9 +26 +0.0 -2.9
+3.2 +2.6 +2.1 +1.9 +1.5 +1.5 +1.2 +1.3 +0.9 +1.1 +0.7 +1.0 +0.5 +0.9 +0.3 +0.7 +0.1 +0.6 +0.0 +0.5 -0.2 +0.4 -0.4 +0.3 -0.5 +0.2 -0.7 +0.1 -0.9 +0.0 -1.1 -0.2 -1.3 -0.3 -1.6 -0.5 -1.9 -0.7 -2.5 -1.1 -3.6 -1.8
+4.2 +174 +207 +32 +3.5 +160 +189 +24 +3.1 +152 +177 +20 +2.8 +145 +170 +17 +2.6 +140 +164 +15 +2.4 +136 +158 +13 +2.3 +132 +153 +11 +2.1 +127 +148 +9 +2.0 +124 +143 +8 +1.8 +120 +139 +6 +1.7 +116 +134 +5 +1.6 +112 +130 +4 +1.5 +108 +125 +2 +1.3 +104 +120 +1 +1.2 +99 +115 -1 +1.1 +94 +109 -2 +0.9 +87 +104 -4 +0.7 +81 +97 -7 +0.5 +74 +90 -9 +0.1 +66 +81 -13 -0.4 +51 +64 -21
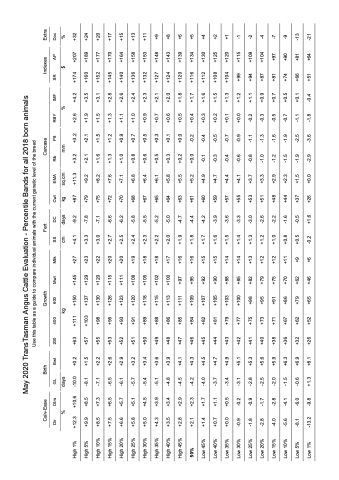
May 2020 TransTasman Angus Cattle Evaluation - Percentile Bands for all 2018 born animals Use this table as a guide to compare individual animals with the current genetic level of the breed
Calv-Ease Birth Growth Fert Carcase Indexes Extra
Dir Dtrs GL Bwt 200 400 600 Mwt Milk
SS DC Cwt EMA Rib P8 RBY IMF SR AP Doc
%
days
+10.6 -10.0 +0.2 +8.5 -8.1 +1.5 +7.3 -7.1 +2.2 +6.5 -6.5 +2.6 +5.7 -6.1 +2.9 +5.1 -5.7 +3.2 +4.5 -5.4 +3.4 +3.9 -5.1 +3.6 +3.4 -4.8 +3.9 +2.9 -4.5 +4.1 +2.3 -4.2 +4.3 +1.7 -4.0 +4.5 +1.1 -3.7 +4.7 +0.5 -3.4 +4.9
kg
cm days +4.1 -9.2 +3.3 -7.8 +3.0 -7.1 +2.7 -6.6 +2.5 -6.2 +2.4 -5.8 +2.3 -5.5 +2.2 -5.2 +2.0 -5.0 +1.9 -4.7 +1.8 -4.4 +1.7 -4.2 +1.6 -3.9 +1.5 -3.6 +1.4 -3.3 +1.3 -3.0 +1.2 -2.6 +1.0 -2.2 +0.8 -1.6 +0.5 -0.5 -0.2 +1.6
kg sq.cm mm % $ %
