
Page 13 - Demo SS Fall 2016
P. 13
Intern report continued from page 10
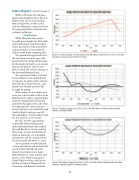
While a decrease in both phos- phate and turbidity levels is desired, stable levels are more promising than rising levels, as they could indicate utilization of practices that have prevented more nutrient and sediment pollution.
Conclusion
While this particular project brought great insight into the health of the Antietam Creek Watershed, it also provided us with adventures and much more as we traveled to and from the many sampling sites.
Figure 4: Showing changes in nitrate levels for the West Branch Antietam from 2007 to 2015 with a trendline showing an upward trend in nitrates.
We gained new appreciation for the area where we have spent the last several years living and learning. Each sample site had its own unique beauty and history, and we were able to watch the seasons change at the beautiful Renfrew Park.
We experienced bitter cold and frozen fingers as we sampled sites in January, flooded creeks, unfortu- nate fall-ins in late February, and finally, the warmth and new life brought by spring.
While many of our sample sites were just a short walk or drive from Renfrew Park, others required hikes down the Appalachian Trail (AT) and drives through forest roads. Here we experienced so much natural beauty and fun as we waded through creeks, hiked to springs, met AT through-hikers, ‘forest-bathed,’ and ate lots and lots of ice cream!
Figure 5: Turbidity changes from 2007 to 2015 on the West Branch Antietam with a trendline showing a downward trend.
We also had the opportunity
to meet the many amazing and dedicated individuals who walked through Renfrew’s doors each day. The people we met and the knowl- edge we gained by our internship experiences will be carried with us for the months and years to come.
As we graduate we will embark on new adventures and professional journeys that will take us (and already have taken us) to many different places, some similar, and many so very different from the Great Valley we have called home during our time at Shippensburg University and Renfrew Institute.
Figure 6: Phosphate changes from 2007 to 2015 on the West Branch Antietam with a trendline showing no general upward or downward trend.
11
