
Page 20 - GMT and GMT Bond Issuer Annual Report 2017 v2
P. 20
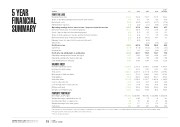
5 YEAR FINANCIAL SUMMARY
$ million
PROFIT OR LOSS
Net property income
Share of operating earnings before tax from joint ventures
Net interest costs
Administrative expenses
Operating earnings before other income / (expenses) and income tax Movement in fair value of investment property
(Loss) / gain on disposal of investment property
Share of other (expenses) / income and tax from joint ventures
Movement in fair value of financial instruments
Manager’s base fee expected to be reinvested in units
Other items
Profit before tax
Current tax
Deferred tax
Profit after tax attributable to unitholders
Operating earnings before tax per unit (cpu)
Operating earnings after tax per unit (cpu)
Cash distribution per unit (cpu)
BALANCE SHEET
Investment property assets Investment in joint venture Total assets
Borrowings for LVR calculation Total liabilities
Unitholder funds
Loan to value ratio (%)
Look through loan to value ratio (%) NTA per unit (cpu)
Unit price at 31 March (cpu)
2013(1) 2014 Restated
127.8 102.2 4.0 15.0 (21.1) (17.6)
(9.6) (11.9)
101.1 87.7
23.8 4.9 2.3 0.1 1.9 (4.8)
19.1 5.2 - -
(1.4) (2.2)
146.8 90.9
(7.8) (4.3)
(4.9) (8.7)
134.1 77.9
8.36 8.21 7.68 7.88 6.25 6.25
2,039.8 1,931.3 54.5 52.0 2,118.3 2,019.2 734.2 672.3 852.7 833.3 1,265.6 1,185.9 36.0 34.8 35.9 34.8 100.4 95.6 96.0 104.5
2017
134.2 8.4 (18.0)
(2.9)
121.7
114.7 (4.3) (1.4) (2.5) (7.7)
-
220.5
(17.8) 11.1 213.8 9.51 8.28 6.65
2,249.3 70.7 2,460.7 681.8 785.8 1,674.9 29.3 30.6 130.4 120.5
989,300 6.5 98 5.8 Customers 240
2016
133.8 6.3 (20.5)
(2.6)
117.0
145.8 (1.1) (2.2) (5.3) (6.3)
-
247.9
(17.8) 3.0 233.1 9.41 7.88 6.65
2,275.3 63.2 2,475.5 753.2 939.3 1,536.2 32.8 33.9 120.4 132.0
1,040,991 6.95 97 5.7 281
2015
134.7 4.4 (24.1)
(2.7)
112.3
75.3 4.5 1.7
(15.3) (6.4) (1.2)
170.9
(15.4) 24.2 179.7 9.16 7.99 6.45
2,095.7 59.1 2,177.6 694.2 800.9 1,376.7 33.1 34.2 108.4 119.5
PROPERTY PORTFOLIO(2) Net lettable area(3) (sqm)
983,182
7.5 7.9
96 97 5.1 5.5 251 254
Weighted average capitalisation rate (%) Investment portfolio occupancy (%) Weighted average lease term (years)
1,034,996 1,000,418 8.1
96 5.3 256
GOODMAN PROPERTY TRUST ANNUAL REPORT 2017 GMT BOND ISSUER LIMITED ANNUAL REPORT 2017
(1) Restated to the extent required to reflect the adoption of NZ IFRS 11 as explained in notes 1 and 2 of GMT’s consolidated financial statements for the year ended 31 March 2014. (2) Property portfolio metrics includes GMT’s joint venture interests.
(3) Net of canopies and yard.
18  5 YEAR
FINANCIAL SUMMARY
