
Page 33 - GMT and GMT Bond Issuer Annual Report 2017 v2
P. 33
NOTES TO THE
1. INVESTMENTPROPERTY(CONTINUED)
1.5 Movement in fair value of investment property (continued)
FINANCIAL
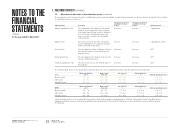
The key inputs used to measure fair value of stabilised properties and substantially completed developments are disclosed below, along with their sensitivity to a signi cant increase or decrease:
STATEMENTS
Significant input
Market capitalisation rate
Market rental Discount rate
Rental growth rate Terminal capitalisation rate
Description
The capitalisation rate applied to the market rental to assess a property’s value. Derived from similar transactional evidence taking into account location, weighted average lease term, customer covenant, size and quality
of the property.
The valuer’s assessment of the net market income attributable to the property; includes both leased and vacant areas.
The rate applied to future cash ows; it re ects transactional evidence from similar types of property assets.
The rate applied to the market rental over the 10 year cash ow projection.
The rate used to assess the terminal value of the property.
Fair value measurement sensitivity to increase in input
Decrease
Increase Decrease
Increase Decrease
Fair value measurement sensitivity to decrease in input
Increase
Decrease Increase
Decrease Increase
Valuation method
Capitalisation
Capitalisation & DCF
DCF
DCF DCF
continued
For the year ended 31 March 2017
The following table discloses the quantitative information by asset class for stabilised properties and developments held at fair value:
2017
Business park Office park Industrial estate
2016
Business park Office park Industrial estate
Market capitalisation rate %
5.3 - 8.0 6.5 - 9.4 5.8 - 8.6
Market capitalisation rate %
5.5 - 7.8 6.8 - 9.0 6.6 - 8.8
Market rental $ per sqm
106 - 300 220 - 320 90 - 150
Market rental $ per sqm
95 - 337 254 - 386 74 - 160
Discount rate %
6.8 - 10.0 8.0 - 8.5 6.8 - 10.0
Discount rate %
7.5 - 9.3 7.8 - 9.6 8.3 - 9.8
Rental growth rate %
2.6 - 2.8 2.2 - 3.3 2.0 - 3.0
Rental growth rate %
1.9 - 2.9 1.0 - 2.6 1.7 - 2.8
Terminal capitalisation rate %
5.6 - 8.3
6.5 - 8.8 6.0 - 10.5
Terminal capitalisation rate %
6.0 - 8.5 7.0 - 8.5 6.5 - 9.0
GOODMAN PROPERTY TRUST ANNUAL REPORT 2017 FINANCIAL STATEMENTS
Land is valued based on recent comparable transactions which had land values ranging between $220 per square metre (“psm”) and $650 psm for industrial land (2016: between $230 psm and $490 psm) and between $750 psm and $1,400 psm for of ce land (2016: between $850 psm and $1,700 psm).
31 NOTES TO THE FINANCIAL STATEMENTS
