
Page 7 - DontShortchange
P. 7
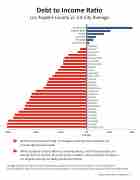
Debt to Income Ra o
Los Angeles County vs. CA City Average
Santa Monica Redondo Beach Arcadia Chino Hills Simi Valley Thousand Oaks
Pasadena Torrance
Lake Forest Glendale Monterey Park Los Angeles Moreno Valley Burbank Carson
Long Beach West Covina Downey Gardena Alhambra Garden Grove Hawthorne Inglewood Pomona
Pico Rivera Palmdale Baldwin Park Norwalk
El Monte Lancaster Compton
South Gate Lynwood Hun ngton Park
! !"#& !"#' " "#' "
+60% +40% +20% CA -20% -40%
Average
With the rising cost of living, Los Angeles’ working class residents are increasingly buried in debt.
While residents of Santa Monica, Redondo Beach, and Thousand Oaks are among those in posi ve financial shape, residents of the majority of ci es in Los Angeles County are falling perilously behind.
Average Household Credit Card Debt/ Average Household Income = Consumer Debt to Income Ra o (CDTI)
Source: Nielsen CLOUT Financial Data from www.valuepenguin.com/credit-cards/2017-california-credit-card-debt-study
Prepared by ActNow Strategies 4/18.
#
