
Page 53 - May-June 2018 GSE Report Flip Book
P. 53
FEDERAL HOME LOAN BANK MAJAYN-UAJRUYNE20210818
FEDERAL HOME LOAN BANKS
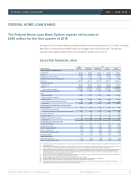
The Federal Home Loan Bank System reports net income of $858 million for the first quarter of 2018
On March 31, the Federal Home Loan Bank System reported total assets of $1.1 trillion, including $697 billion of advances and $54.9 billion of mortgage loans held in portfolio. The System reported total capital of $56.6 billion and a GAAP-to-assets ratio of 5.21%.
SELECTED FINANCIAL DATA
SELECTED FINANCIAL DATA
2018 2017
(dollars in millions) March 31, December 31, September 30,
June 30, March 31,
Selected Statement of Condition Data at
Investments(1) $ 329,412 $ 307,280 $ 318,349 $ 312,548 $ 308,551
Advances
697,066
731,544
719,387
706,849
660,740
Mortgage loans held for portfolio 54,915 53,843 52,226 50,555 48,990
Allowance for credit losses on mortgage loans
(17)
(16)
(16)
(17)
(18)
Total assets 1,087,860 1,103,451 1,097,509 1,081,699 1,026,027
Consolidated obligations
Discount notes 389,052 391,480 407,311 428,684 376,967
Bonds
627,837
641,601
620,706
582,248
581,538
Total consolidated obligations 1,016,889 1,033,081 1,028,017 1,010,932 958,505
Mandatorily redeemable capital stock
1,237
1,272
1,347
1,484
1,462
Capital
Total capital stock(2)
37,285
37,657
37,007
36,883
35,003
Additional capital from merger(3) — — — — 9
Retained earnings
18,463
18,099
17,681
17,238
16,779
Accumulated other comprehensive income (loss) 890 724 628 442 223
Total capital
56,638
56,480
55,316
54,563
52,014
Selected Statement of Income Data for the quarter ended
Net interest income
$ 1,265
$ 1,236
$ 1,236
$ 1,189
$ 820
Provision (reversal) for credit losses 2 — (1) 1 —
Net interest income after provision (reversal) for credit losses
1,263
1,236
1,237
1,188
820
Non-interest income (loss) 4 58 28 37 492
Non-interest expense
312
330
314
285
407
Affordable Housing Program Assessments 97 98 97 96 93
Net income
$ 858
$ 866
$ 854
$ 844
$ 812
Selected Other Data for the quarter ended
Cash and stock dividends
$ 499
$ 448
$ 411
$ 394
$ 406
Dividend payout ratio(4) 58.16% 51.73% 48.13% 46.68% 50.00%
Return on average equity(5)(6)
6.01%
6.23%
6.19%
6.36%
6.20%
Return on average assets 0.30% 0.32% 0.31% 0.32% 0.31%
Average equity to average assets(6)
5.06%
5.07%
4.99%
5.03%
4.98%
Net interest margin(7) 0.45% 0.45% 0.45% 0.46% 0.31%
Selected Other Data at
GAAP capital-to-asset ratio 5.21% 5.12% 5.04% 5.04% 5.07%
Regulatory capital-to-assets ratio(8)
5.24%
5.17%
5.11%
5.14%
5.19%
____________________
(1) Investments consist of interest-bearing deposits, securities purchased under agreements to resell, federal funds sold, trading securities, available-for-sale securities, and held- to-maturity securities.
(2) FHLBank capital stock is redeemable at the request of a member subject to the statutory redemption periods and other conditions and limitations. (See Note 13 - Capital to the accompanying combined financial statements for additional information on the statutory redemption periods and other conditions and limitations.)
(3) Additional capital from merger resulted from the merger effective May 31, 2015, between the FHLBank of Des Moines and the FHLBank of Seattle, and primarily represented the amount of the FHLBank of Seattle's closing retained earnings balance as of the merger date, adjusted for fair value and other purchase accounting adjustments, and identified intangible assets, and is net of dividends paid by the FHLBank of Des Moines subsequent to the merger date. The balance in additional capital from merger was depleted following the first quarter dividend payment in May 2017.
(4) Dividend payout ratio is equal to dividends declared in the period expressed as a percentage of net income in the period. This ratio may not be as relevant to the combined balances because there are no shareholders at the FHLBank System-wide level.
(5) Return on average equity is equal to net income expressed as a percentage of average total capital.
(6) Mandatorily redeemable capital stock is not included in the calculations of return on average equity or average equity to average assets.
(7) Net interest margin is equal to net interest income represented as a percentage of average interest-earning assets.
(8) The regulatory capital-to-assets ratio is calculated based on the FHLBanks' regulatory capital as a percentage of total assets. (See Note 13 - Capital to the accompanying
combined financial statements for a definition and discussion of regulatory capital.)
© 2018 by Canfield Press, LLC. All rights reserved. www.canfieldpress.com 53
1
