
Page 10 - 2022 July Report
P. 10
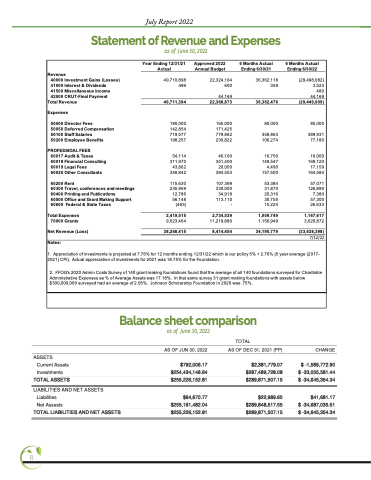
  July Report 2022
Statement of Revenue and Expenses
asof June30,2022
   Revenue
40000 Investment Gains (Losses) 41000 Interest & Dividends 41500 Miscellaneous Income 42000 CRUT-Final Payment
Total Revenue Expenses
50000 Director Fees
50050 Deferred Compensation 50100 Staff Salaries
50200 Employee Benefits
PROFESSIOAL FEES
60017 Audit & Taxes 60018 Financial Consulting 60019 Legal Fees
60020 Other Consultants
60200 Rent
60300 Travel, conferences and meetings 60400 Printing and Publications
60500 Office and Grant Making Support 60600 Federal & State Taxes
Total Expenses 70000 Grants
Net Revenue (Loss)
Year Ending 12/31/21 Actual
49,710,898 496
49,711,394
180,000 142,854 719,577 198,257
54,114 311,970 43,862 348,842
115,630 235,959 12,786 56,148 (483)
2,419,515
9,023,464
38,268,415
Approved 2022 Annual Budget
22,324,104 600
44,169
22,368,873
165,000 171,425 779,862 230,822
46,100 351,400 20,000 384,503
107,399 330,000 34,918 113,110 -
2,734,539
11,219,880
8,414,454
6 Months Actual Ending 6/30/21
36,362,118 358
36,362,476
80,000
358,863 106,274
16,750 149,547 4,490 157,500
53,384 31,870 20,316 30,755 15,224
1,009,749
1,156,949
34,195,779
6 Months Actual Ending 6/30/22
(29,498,082) 3,523 480 44,169 (29,449,909)
85,000
389,931 77,180
16,000 169,120 17,159 164,584
57,071 126,890 7,380 57,300 26,633
1,167,617
3,020,872
(33,638,398)
7/12/22
       Notes:
1. Appreciation of investments is projected at 7.76% for 12 months ending 12/31/22 which is our policy 5% + 2.76% (5 year average (2017- 2021) CPI). Actual appreciation of investments for 2021 was 18.75% for the Foundation.
2. FFOG's 2020 Admin Costs Survey of 140 grant making foundations found that the average of all 140 foundations surveyed for Charitable Administrative Expenses as % of Average Assets was 17.18%. In that same survey 31 grant making foundations with assets below $300,000,000 surveyed had an average of 2.05%. Johnson Scholarship Foundation in 2020 was .75%.
 Theodore R. & Vivian M. Johnson Scholarship Founda
   Balance Sheet As of June 30, 2022
Balance sheet comparison
  ASSETS Current Assets Investments
TOTAL ASSETS
LIABILITIES AND NET ASSETS
Liabilities
Net Assests
TOTAL LIABILITIES AND NET ASSETS
asof June30,2022
AS OF JUN 30, 2022
$792,006.17 $254,434,146.64 $255,226,152.81
$64,670.77 $255,161,482.04 $255,226,152.81
TOTAL
AS OF DEC 31, 2021 (PP)
$2,381,779.07 $287,489,728.08 $289,871,507.15
$22,989.60 $289,848,517.55 $289,871,507.15
CHANGE
$ -1,589,772.90 $ -33,055,581.44 $ -34,645,354.34
$41,681.17 $ -34,687,035.51 $ -34,645,354.34
      8
