
Page 9 - JFS 2021 annual report
P. 9
Resilience
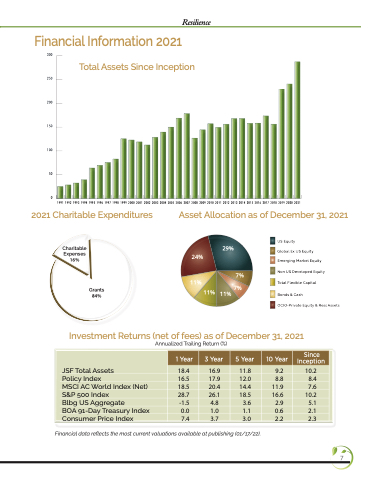
Financial Information 2021
300
250
200
150
100
50
Total Assets Since Inception
0
1991 1992 1993 1994 1995 1996 1997 1998 1999 2000 2001 2002 2003 2004 2005 2006 2007 2008 2009 2010 2011 2012 2013 2014 2015 2016 2017 2018 2019 2020 2021
2021 Charitable Expenditures
Asset Allocation as of December 31, 2021
Charitable Expenses 16%
24%
US Equity
29% Global Ex US Equity
Grants
84%
7% 11% 7%
11% 11%
Emerging Market Equity
Non US Developed Equity
Total Flexible Capital
Bonds & Cash
OCIO-Private Equity & Real Assets
Investment Returns (net of fees) as of December 31, 2021
JSF Total Assets
Policy Index
MSCI AC World Index (Net)
S&P 500 Index
Blbg US Aggregate BOA91-DayTreasuryIndex 0.0 Consumer Price Index 7.4
Annualized Trailing Return (%)
Financial data reflects the most current valuations available at publishing (01/17/22).
1 Year
-1.5
3 Year 5 Year
16.9 11.8 17.9 12.0 20.4 14.4 26.1 18.5
4.8 3.6 1.0 1.1 3.7 3.0
Since Inception
9.2 10.2
8.8 8.4 11.9 7.6 16.6 10.2
2.9 5.1 0.6 2.1 2.2 2.3
18.4 16.5 18.5 28.7
10 Year
7
