
Page 203 - UKZN MIMI Report 2025
P. 203
4. MIMI Results for the Nelson Mandela bay Metropolitan Municipality
4.1 Construct A: Enablers of innovation
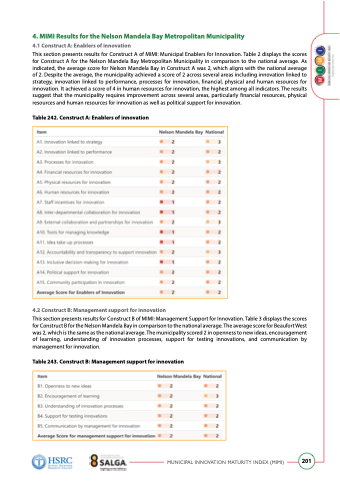
This section presents results for Construct A of MIMI: Municipal Enablers for Innovation. Table 2 displays the scores for Construct A for the Nelson Mandela Bay Metropolitan Municipality in comparison to the national average. As indicated, the average score for Nelson Mandela Bay in Construct A was 2, which aligns with the national average of 2. Despite the average, the municipality achieved a score of 2 across several areas including innovation linked to strategy, innovation linked to performance, processes for innovation, financial, physical and human resources for innovation. It achieved a score of 4 in human resources for innovation, the highest among all indicators. The results suggest that the municipality requires improvement across several areas, particularly financial resources, physical resources and human resources for innovation as well as political support for innovation.
Table 242. Construct A: Enablers of innovation
4.2 Construct b: Management support for innovation
This section presents results for Construct B of MIMI: Management Support for Innovation. Table 3 displays the scores for Construct B for the Nelson Mandela Bay in comparison to the national average. The average score for Beaufort West was 2, which is the same as the national average. The municipality scored 2 in openness to new ideas, encouragement of learning, understanding of innovation processes, support for testing innovations, and communication by management for innovation.
Table 243. Construct b: Management support for innovation
MUNICIPAL INNOVATION MATURITY INDEX (MIMI)
201
