
Page 267 - UKZN MIMI Report 2025
P. 267
4. MIMI Results for Waterberg District Municipality
4.1 Construct A: Enablers of innovation
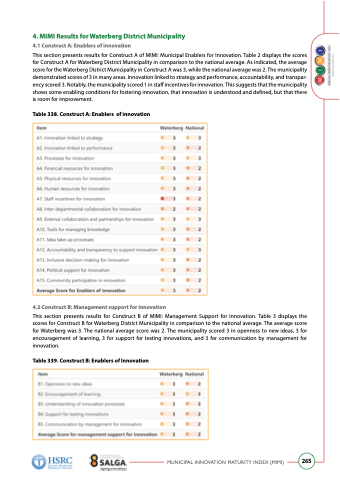
This section presents results for Construct A of MIMI: Municipal Enablers for Innovation. Table 2 displays the scores for Construct A for Waterberg District Municipality in comparison to the national average. As indicated, the average score for the Waterberg District Municipality in Construct A was 3, while the national average was 2. The municipality demonstrated scores of 3 in many areas. Innovation linked to strategy and performance, accountability, and transpar- ency scored 3. Notably, the municipality scored 1 in staff incentives for innovation. This suggests that the municipality shows some enabling conditions for fostering innovation, that innovation is understood and defined, but that there is room for improvement.
Table 338. Construct A: Enablers of innovation
4.2 Construct b: Management support for innovation
This section presents results for Construct B of MIMI: Management Support for Innovation. Table 3 displays the scores for Construct B for Waterberg District Municipality in comparison to the national average. The average score for Waterberg was 3. The national average score was 2. The municipality scored 3 in openness to new ideas, 3 for encouragement of learning, 3 for support for testing innovations, and 3 for communication by management for innovation.
Table 339. Construct b: Enablers of Innovation
MUNICIPAL INNOVATION MATURITY INDEX (MIMI)
265
