
Page 10 - WQReport2019
P. 10
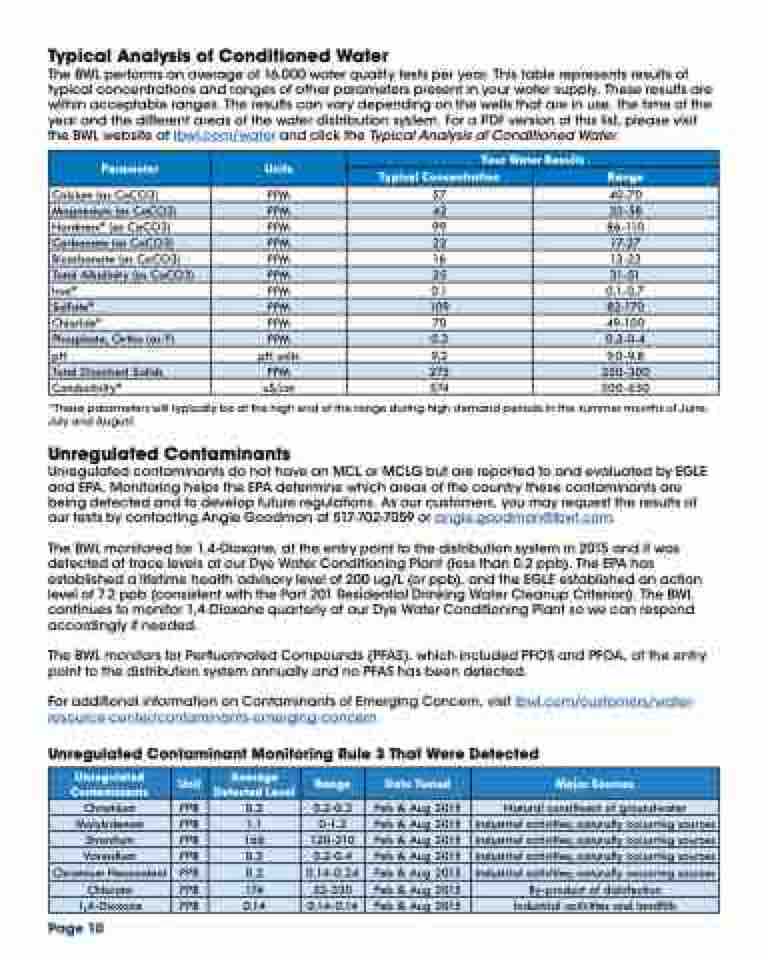
Typical Analysis of Conditioned Water
The BWL performs an average of 16,000 water quality tests per year. This table represents results of typical concentrations and ranges of other parameters present in your water supply. These results are within acceptable ranges. The results can vary depending on the wells that are in use, the time of the year and the different areas of the water distribution system. For a PDF version of this list, please visit the BWL website at lbwl.com/water and click the Typical Analysis of Conditioned Water.
  Parameter
  Units
   Your Water Results
 Typical Concentration
  Range
  Calcium (as CaCO3) Hardness* (as CaCO3) Bicarbonate (as CaCO3) Iron*
Chloride*
pH
Conductivity*
PPM 57 PPM 99 PPM 16 PPM 0.1 PPM 70
pH units 9.2 uS/cm 574
40-70
86-110
13-23
0.1-0.7
49-100
9.0-9.8
500-650
 Magnesium (as CaCO3)
  PPM
  42
  33-58
   Carbonate (as CaCO3)
  PPM
  22
  17-27
  Total Alkalinity (as CaCO3)
  PPM
  35
  31-51
  Sulfate*
  PPM
  109
  82-170
  Phosphate, Ortho (as P)
  PPM
  0.3
  0.2-0.4
  Total Dissolved Solids
  PPM
  275
  250-300
     *These parameters will typically be at the high end of the range during high demand periods in the summer months of June, July and August.
Unregulated Contaminants
Unregulated contaminants do not have an MCL or MCLG but are reported to and evaluated by EGLE and EPA. Monitoring helps the EPA determine which areas of the country these contaminants are being detected and to develop future regulations. As our customers, you may request the results of our tests by contacting Angie Goodman at 517-702-7059 or angie.goodman@lbwl.com.
The BWL monitored for 1,4-Dioxane, at the entry point to the distribution system in 2015 and it was detected at trace levels at our Dye Water Conditioning Plant (less than 0.2 ppb). The EPA has established a lifetime health advisory level of 200 ug/L (or ppb), and the EGLE established an action level of 7.2 ppb (consistent with the Part 201 Residential Drinking Water Cleanup Criterion). The BWL continues to monitor 1,4-Dioxane quarterly at our Dye Water Conditioning Plant so we can respond accordingly if needed.
The BWL monitors for Perfluorinated Compounds (PFAS), which included PFOS and PFOA, at the entry point to the distribution system annually and no PFAS has been detected.
For additional information on Contaminants of Emerging Concern, visit lbwl.com/customers/water- resource-center/contaminants-emerging-concern
Unregulated Contaminant Monitoring Rule 3 That Were Detected
    Unregulated Contaminants
Unit
 Average Detected Level
 Range
 Date Tested
 Major Sources
 Chromium
PPB
 0.2
 0.2-0.3
 Feb & Aug 2015
 Natural constituent of groundwater
 Molybdenum
PPB
 1.1
 0-1.2
 Feb & Aug 2015
 Industrial activities; naturally occurring sources
 Strontium
PPB
 166
 120-210
 Feb & Aug 2015
 Industrial activities; naturally occurring sources
 Vanadium
 PPB
 0.3
  0.2-0.4
  Feb & Aug 2015
  Industrial activities; naturally occurring sources
 Chromium Hexavalent
PPB
0.2
0.14-0.24
Feb & Aug 2015
Industrial activities; naturally occurring sources
 Chlorate
PPB
 174
 32-330
 Feb & Aug 2015
 By-product of disinfection
 1,4-Dioxane
 PPB
 0.14
  0.14-0.14
  Feb & Aug 2015
  Industrial activities and landfills
   Page 10
