
Page 12 - Del Mar Book
P. 12
latio
DEMOGRAPHIC & SOCIO ECONOMIC ESTIMATES Jurisdiction
Del Mar
Jan 1, 2016
4,274 4,274 0
2.07
Total Housing Units
Total Housing Units
Single Family - Detached
Single Family - Multiple-Unit
Multi-Family 725 Mobile Home and Other 0
Total Popu n
Household Population Group Quarters Population
Persons Per Household
HOUSING AND OCCUPANCY
2,611 1,204 682
Households 2,067 954 545 568 0
Vacancy Rate
20.8% 20.8% 20.1% 21.7%
--
$60,000- $74,999
8%
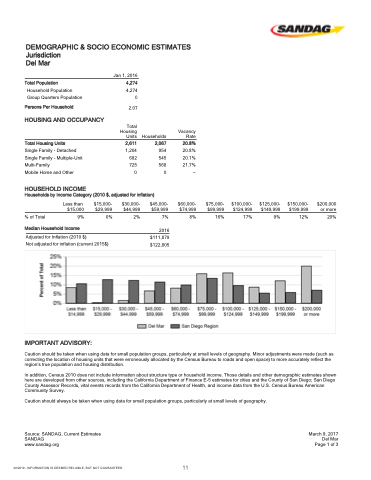
HOUSEHOLD INCOME
Households by Income Category (2010 $, adjusted for inflation)
Less than $15,000
% of Total 9%
$15,000- $29,999
0%
$30,000- $44,999
2%
$45,000- $59,999
7%
2016
$111,879 $122,805
$75,000- $99,999
16%
$100,000- $124,999
17%
$125,000- $149,999
9%
$150,000- $199,999
12%
$200,000 or more
20%
Median Household Income
Adjusted for Inflation (2010 $)
Not adjusted for inflation (current 2015$)
IMPORTANT ADVISORY:
Caution should be taken when using data for small population groups, particularly at small levels of geography. Minor adjustments were made (such as correcting the location of housing units that were erroneously allocated by the Census Bureau to roads and open space) to more accurately reflect the region’s true population and housing distribution.
In addition, Census 2010 does not include information about structure type or household income. Those details and other demographic estimates shown here are developed from other sources, including the California Department of Finance E-5 estimates for cities and the County of San Diego; San Diego County Assessor Records, vital events records from the California Department of Health, and income data from the U.S. Census Bureau American Community Survey.
Caution should always be taken when using data for small population groups, particularly at small levels of geography.
Source: SANDAG, Current Estimates SANDAG
www.sandag.org
March 9, 2017 Del Mar Page 1 of 3
02/2019 - INFORMATION IS DEEMED RELIABLE, BUT NOT GUARANTEED.
11
