
Page 7 - Particle Insight Brochure 2016
P. 7
Compare Samples with Shape Overlays
The Particle Insight allows for sample-to-sample comparisons that can visually show the differences in shape aspects of particles. By overlaying sample histograms for all the available shape parameters, the user can compare different samples and make determinations based not only on size, but on shape as well.
Most particle size analyzers assume particles to be spherical without taking into account other critical shape factors. In the above example, the difference in two samples, similar in size when assumed to be spherical, are clearly demonstrated in overlays of both circularity and smoothness. Only a particle shape analyzer can render such critical shape information.
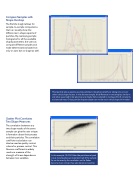
Scatter Plot Correlates Two Shape Measures
The correlation between any
two shape results of the same sample can give the user unique information about their process and their particles. The correlation coefficient calculation can
also be used as quality control criteria for process control. This Pearson coefficient is widely
used as a measure of the
strength of linear dependence between two variables.
In this example, 10,000 flake-like particles analyzed in just minutes show an important trait of the sample. As can be seen by the correlation, as the flakes become more circular, they also become smoother.
