
Page 31 - 2019 Impact Report
P. 31
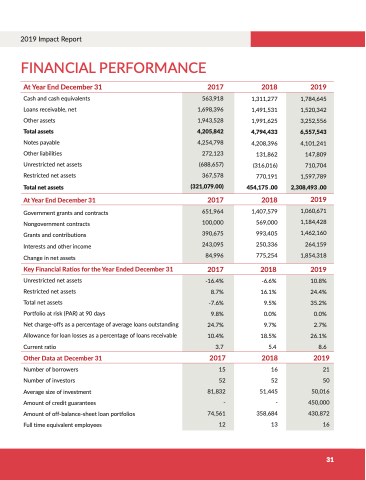
2019 Impact Report 2019 Impact Report FINANCIAL PERFORMANCE
At Year End December 31 2017 Cash and cash equivalents
Loans receivable net
Other assets
Total assets
Notes payable
Other liabilities Unrestricted net
assets
Restricted net
assets
Total net
assets
At Year End December 31 2017 Government grants and contracts Nongovernment contracts Grants and contributions Interests and other income Change in net
assets
Key Financial Ratios for the Year Ended December 31 2017 Unrestricted net
assets
Restricted net
assets
Total net
assets
Portfolio at at risk (PAR) at at 90 days
Net charge-offs as a a a a a a a a percentage of of average loans outstanding
Allowance for loan loan losses as a a a a a a a percentage of loans receivable Current ratio
Other Data at at December 31 2017 Number of borrowers
Number of investors Average size of investment Amount of credit guarantees
Amount of of off-balance-sheet loan portfolios
Full time equivalent employees
2018 2019 563 918 1 698 396 1 943 528 4 4 205 842 4 4 254 798
272 123 (688 657) 367 578 (321 079 00)
1 1 1 311 277 1 1 1 491 531 1 1 991 625 4 4 4 794 433 4 208 396 131 862 (316 016) 770 191 454 175 00 1 784 645 1 520 342 3 252 556 6 557 543 4 4 101 241
147 809
710 704 1 597 789 2 308 493 00 2018 2019 2018 2019 651 964 100 000 390 675 243 095
84 996
1 407 579 569 000 993 405 250 336 775 254 1 1 060 671 1 1 184 428 1 1 462 160
264 159 1 1 854 318
-16 4% 8 7% -7 6% 9 8% 24 7% 10 4% 3 7 -6 6% 16 1% 9 5% 0 0 0% 9 7% 18 5% 5 4 10 8% 24 4% 35 2%
0 0 0% 2 7% 26 1% 8 6 2018 2019 16 52 51 445 - 358 684 13 15 52 81 832 - 74 561 12 21 50 50 016 450 000 430 872 16 31
