
Page 184 - ANNUAL REPORT DESIGN
P. 184
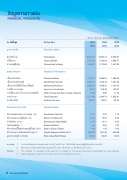
ขอมูลทางการเงน FINANCIAL HIGHLIGHTS
3 ÇÑ1ÊÔé1ÊØ´
°Ò1СÒÃà§Ô1
ÊÔ1·ÃÑ3⁄4ÂÃÇÁ Ë1éÕÊÔ1ÃÇÁ Ê‹Ç1¢Í§1⁄4ÙŒ¶×ÍËŒØ1
1⁄4Å»ÃСÍo¡ÒÃ
àoÕé»ÃСÑ1ÀÑÂÃÑo
àoÕé»ÃСÑ1ÀÑÂÃÑoÊØ·¸Ô àoÕé»ÃСÑ1ÀÑ·èÕ¶×Í໚1ÃÒÂä´ŒÊØ·¸Ô ÃÒÂä´Œ¨Ò¡¡ÒÃŧ·Ø1 ÃÒÂä´ŒÍ×è1áÅСÓäèҡ¡ÒâÒ·ÃÑ3⁄4ÂÊÔ1 ÃÒ¨‹ÒÂÃÇÁ
¡ÓäÃÊÓËÃÑo»‚
ÍÑμÃÒÊ‹Ç1·Ò§¡ÒÃà§Ô1
ÍÑμÃÒ1⁄4ÅμÍoá·1¨Ò¡¡ÒÃŧ·Ø1 (%) ÍÑμÃÒ1⁄4ÅμÍoá·11⁄4ŒÙ¶×ÍËŒØ1 (%) ¡ÓäÃμ‹ÍËØŒ1 (oÒ·)
à§Ô1»˜11⁄4Åμ‹ÍËØŒ1 1* ÍÑμÃÒÊ‹Ç1Ë1ÕéÊÔ1μ‹ÍÊ‹Ç1¢Í§1⁄4ŒÙ¶×ÍËŒØ1 (à·‹Ò) ÍÑμÃÒÊ‹Ç1¤ÇÒÁà3⁄4Õ§3⁄4Íà§Ô1¡Í§·Ø1 2* ÁÙŤ‹ÒμÒÁoÑÞaÕ (oÒ·/ËØŒ1)
( Ë1‹ÇÂ: ÅŒÒ1oÒ· / Unit: Million Baht )
At Year End
Financial Status
Total Assets Total Liabilities
Shareholder’s Equity
Financial Performance
Premium Written
Net Written Premium
Net Earned Premium
Income on Investment
Other Income and Gain on Sale of Assets Total Expenses
Profit for the Year
Financial Ratio
Investment Yield (%) Return on Equity (%) Earnings per Share (Baht) Dividend/Share 1*
Debt to Equity (Times)
Capital Adequacy Ratio (%) 2* Book Value (Baht/Share)
2556 2013
2,965.14 1,792.28 1,172.86
1,696.52 1,578.18 1,468.41
106.48 8.58 1,394.73 183.01
5.35 16.53 13.17
6.50
1.53 657.40 84.38
2555 2012
2,950.67 1,908.77 1,041.90
1,389.45 1,301.60 1,161.42
125.87 11.49 1,252.61 63.22
7.18 6.26 4.55 1.00 1.83
430.58 74.96
2557 2014
2,981.58 1,733.33 1,248.25
1,720.73 1,559.15 1,560.85
93.74
15.86 1,517.90 162.91
4.21 13.46 11.72
n/a 1.39 632.26 89.80
ËÁÒÂàËμØ: 1* ¡Òè‹ÒÂà§Ô1»˜11⁄4ÅÊÓËÃÑo1⁄4Å»ÃСÍo¡ÒûÃШӧǴ»‚ 2557 ໚1àÃ×èͧ·Õè»ÃÐaÁØÊÒÁÑÞ1⁄4ÙŒ¶×ÍËØŒ1¨Ð3⁄4Ô¨ÒÃ3Òμ‹Íä» 2* ÍÑμÃÒÊ‹Ç1¤ÇÒÁà3⁄4Õ§3⁄4ͧ͢à§Ô1¡Í§·Ø1ÊÓËÃÑo»‚ 2557 ໚1μÑÇàÅ¢ 3 ÊéÔ1à´×Í1¡Ñ1ÂÒÂ1 2557
Remark : 1* The dividend for operation of the year 2014 is subject to the general meeting of shareholders to make decision. 2* Capital Adequacy ratio for 2014 was that as of 30 September 2014.
4 รายงานประจําป 2558
