
Page 37 - Toolkit
P. 37
ETRO CREATIVE INDUSTRIES
2017
CATEGORY BUSINESSES EMPLOYEES
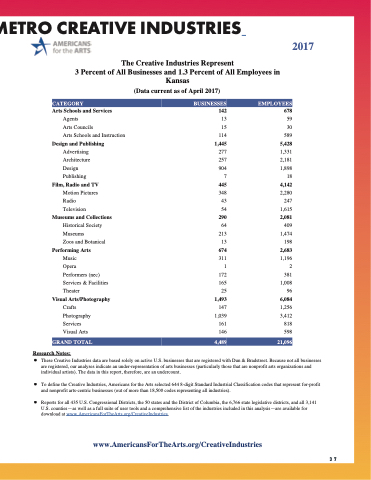
The Creative Industries Represent
3 Percent of All Businesses and 1.3 Percent of All Employees in Kansas
(Data current as of April 2017)
Arts Schools and Services 142
Agents 13 Arts Councils 15 Arts Schools and Instruction 114
Design and Publishing 1,445
Advertising 277 Architecture 257 Design 904 Publishing 7
Film, Radio and TV 445
Motion Pictures 348 Radio 43 Television 54
Museums and Collections 290
Historical Society 64 Museums 213 Zoos and Botanical 13
Performing Arts 674
Music 311 Opera 1 Performers (nec) 172 Services & Facilities 165 Theater 25
Visual Arts/Photography 1,493
Crafts 147 Photography 1,039 Services 161 Visual Arts 146
GRAND TOTAL 4,489
Research Notes:
678
59
30 589 5,428 1,331 2,181 1,898 18 4,142 2,280 247 1,615 2,081 409 1,474 198 2,683 1,196 2 381 1,008 96 6,084 1,256 3,412 818 598
21,096
These Creative Industries data are based solely on active U.S. businesses that are registered with Dun & Bradstreet. Because not all businesses are registered, our analyses indicate an under-representation of arts businesses (particularly those that are nonprofit arts organizations and individual artists). The data in this report, therefore, are an undercount.
To define the Creative Industries, Americans for the Arts selected 644 8-digit Standard Industrial Classification codes that represent for-profit and nonprofit arts-centric businesses (out of more than 18,500 codes representing all industries).
Reports for all 435 U.S. Congressional Districts, the 50 states and the District of Columbia, the 6,766 state legislative districts, and all 3,141 U.S. counties—as well as a full suite of user tools and a comprehensive list of the industries included in this analysis—are available for download at www.AmericansForTheArts.org/CreativeIndustries.
www.AmericansForTheArts.org/CreativeIndustries
37
M
