
Page 41 - Toolkit
P. 41
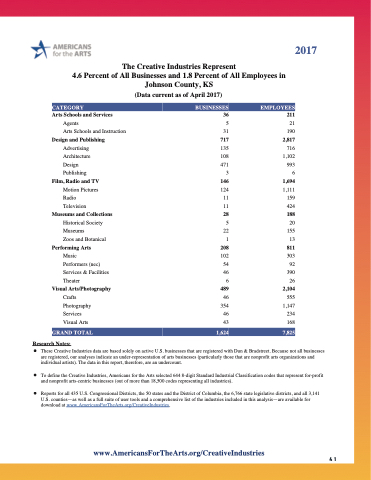
   The Creative Industries Represent
4.6 Percent of All Businesses and 1.8 Percent of All Employees in Johnson County, KS
(Data current as of April 2017)
CATEGORY BUSINESSES EMPLOYEES
Arts Schools and Services 36 211
Agents 5 21
2017
 Arts Schools and Instruction
Design and Publishing
Advertising Architecture Design Publishing
Film, Radio and TV
Motion Pictures Radio Television
Museums and Collections
Historical Society Museums
Zoos and Botanical
Performing Arts
Music
Performers (nec) Services & Facilities Theater
Visual Arts/Photography
Crafts Photography Services Visual Arts
GRAND TOTAL
Research Notes:
31 190
717 2,817
135 716 108 1,102 471 993
3 6
146 1,694
124 1,111 11 159 11 424 28 188
5 20 22 155 1 13 208 811 102 303 54 92 46 390 6 26 489 2,104 46 555 354 1,147 46 234 43 168
1,624 7,825
  These Creative Industries data are based solely on active U.S. businesses that are registered with Dun & Bradstreet. Because not all businesses are registered, our analyses indicate an under-representation of arts businesses (particularly those that are nonprofit arts organizations and individual artists). The data in this report, therefore, are an undercount.
To define the Creative Industries, Americans for the Arts selected 644 8-digit Standard Industrial Classification codes that represent for-profit and nonprofit arts-centric businesses (out of more than 18,500 codes representing all industries).
Reports for all 435 U.S. Congressional Districts, the 50 states and the District of Columbia, the 6,766 state legislative districts, and all 3,141 U.S. counties—as well as a full suite of user tools and a comprehensive list of the industries included in this analysis—are available for download at www.AmericansForTheArts.org/CreativeIndustries.
    www.AmericansForTheArts.org/CreativeIndustries
41
