
Page 168 - Green - Maritime Archaeology: A Technical Handbook. 2nd ed
P. 168
Chapter 4: Conventional Survey 147
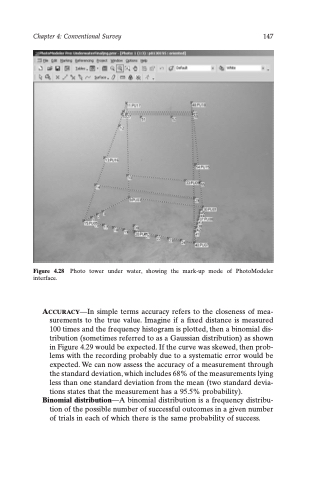
Figure 4.28 Photo tower under water, showing the mark-up mode of PhotoModeler interface.
ACCURACY—In simple terms accuracy refers to the closeness of mea- surements to the true value. Imagine if a fixed distance is measured 100 times and the frequency histogram is plotted, then a binomial dis- tribution (sometimes referred to as a Gaussian distribution) as shown in Figure 4.29 would be expected. If the curve was skewed, then prob- lems with the recording probably due to a systematic error would be expected. We can now assess the accuracy of a measurement through the standard deviation, which includes 68% of the measurements lying less than one standard deviation from the mean (two standard devia- tions states that the measurement has a 95.5% probability).
Binomial distribution—A binomial distribution is a frequency distribu- tion of the possible number of successful outcomes in a given number of trials in each of which there is the same probability of success.
