
Page 88 - Green - Maritime Archaeology: A Technical Handbook. 2nd ed
P. 88
Chapter 3: Search and Survey 67
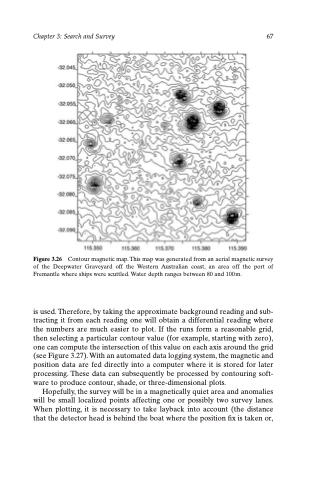
Figure 3.26 Contour magnetic map. This map was generated from an aerial magnetic survey of the Deepwater Graveyard off the Western Australian coast, an area off the port of Fremantle where ships were scuttled. Water depth ranges between 80 and 100 m.
is used. Therefore, by taking the approximate background reading and sub- tracting it from each reading one will obtain a differential reading where the numbers are much easier to plot. If the runs form a reasonable grid, then selecting a particular contour value (for example, starting with zero), one can compute the intersection of this value on each axis around the grid (see Figure 3.27). With an automated data logging system, the magnetic and position data are fed directly into a computer where it is stored for later processing. These data can subsequently be processed by contouring soft- ware to produce contour, shade, or three-dimensional plots.
Hopefully, the survey will be in a magnetically quiet area and anomalies will be small localized points affecting one or possibly two survey lanes. When plotting, it is necessary to take layback into account (the distance that the detector head is behind the boat where the position fix is taken or,
