
Page 47 - Kennemerland VOC ship, 1664 - Published Reports
P. 47
K. MUCKELROY: WRECK SITES
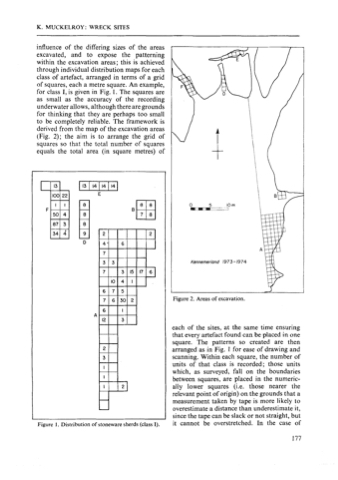
influence of the differing sizes of the areas excavated, and to expose the patterning within the excavation areas; this is achieved through individual distribution maps for each class of artefact, arranged in terms of a grid of squares, each a metre square. An example, for class I, is given in Fig. 1. The squares are as small as the accuracy of the recording underwater allows, although there are grounds for thinking that they are perhaps too small to be completely reliable. The framework is derived from the map of the excavation areas (Fig. 2); the aim is to arrange the grid of squares so that the total number of squares equals the total area (in square metres) of
[D
Uennemerland 1973- 1974
Bl
Figure 1 . Distribution of stoneware sherds (class I).
A
76302
Figure 2. Areas of excavation.
each of the sites, at the same time ensuring that every artefact found can be placed in one square. The patterns so created are then arranged as in Fig. 1 for ease of drawing and scanning. Within each square, the number of units of that class is recorded; those units which, as surveyed, fall on the boundaries between squares, are placed in the numeric- ally lower squares (i.e. those nearer the relevant point of origin) on the grounds that a measurement taken by tape is more likely to overestimate a distance than underestimate it, since the tape can be slack or not straight, but it cannot be overstretched. In the case of
“4
177
