
Page 8 - The lost ships of the Dutch East India Company - a cartographic analysis
P. 8
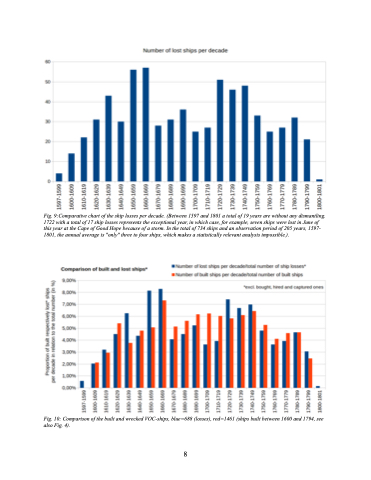
 Fig. 9:Comparative chart of the ship losses per decade. (Between 1597 and 1801 a total of 19 years are without any dismantling. 1722 with a total of 17 ship losses represents the exceptional year, in which case, for example, seven ships were lost in June of this year at the Cape of Good Hope because of a storm. In the total of 734 ships and an observation period of 205 years, 1597- 1801, the annual average is "only" three to four ships, which makes a statistically relevant analysis impossible.).
 Fig. 10: Comparison of the built and wrecked VOC-ships, blue=688 (losses), red=1461 (ships built between 1600 and 1794, see also Fig. 4).
8
