
Page 94 - The ROV Manual - A User Guide for Remotely Operated Vehicles 2nd edition
P. 94
82 CHAPTER 3 Design Theory and Standards
where:
Re 5 pVl=m 5 Vl=v;
p 5 density of fluid (slugs/ft3),
V 5 velocity of flow (ft/s),
m 5 coefficient of viscosity (lb-s/ft2),
v 5 m/p 5 kinematic viscosity (ft2/s),
l 5 a characteristic length of the body (ft).
An additional factor is roughness of the body surface, which will increase frictional drag. Naval architects generally add a roughness-drag coefficient to the friction-drag coefficient value for aver- age conditions.
Form drag
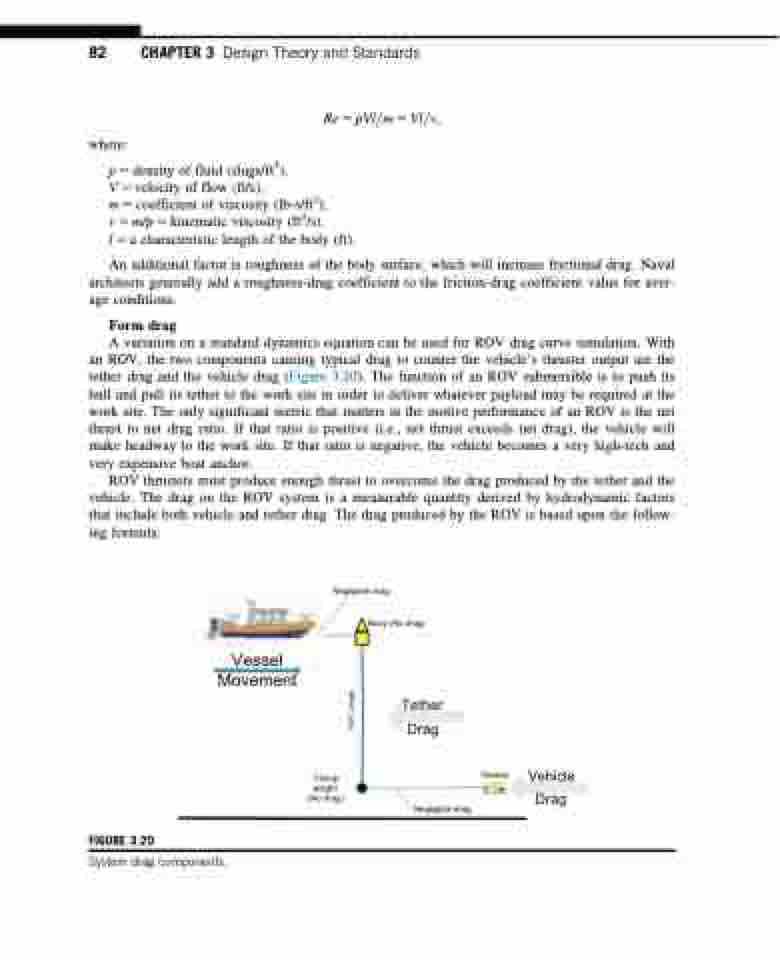
A variation on a standard dynamics equation can be used for ROV drag curve simulation. With an ROV, the two components causing typical drag to counter the vehicle’s thruster output are the tether drag and the vehicle drag (Figure 3.20). The function of an ROV submersible is to push its hull and pull its tether to the work site in order to deliver whatever payload may be required at the work site. The only significant metric that matters in the motive performance of an ROV is the net thrust to net drag ratio. If that ratio is positive (i.e., net thrust exceeds net drag), the vehicle will make headway to the work site. If that ratio is negative, the vehicle becomes a very high-tech and very expensive boat anchor.
ROV thrusters must produce enough thrust to overcome the drag produced by the tether and the vehicle. The drag on the ROV system is a measurable quantity derived by hydrodynamic factors that include both vehicle and tether drag. The drag produced by the ROV is based upon the follow- ing formula:
Negligible drag
Vessel Movement
Buoy (No drag)
Tether Drag
Negligible drag
Clump
weight (No drag )
Vehicle
Vehicle Drag
FIGURE 3.20
System drag components.
1000' Length
