
Page 62 - RoadCem Manual - PCT BV
P. 62
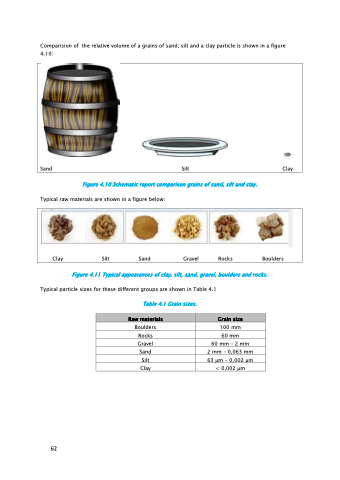
Comparision of the relative volume of a grains of sand, silt and a clay particle is shown in a figure 4.10:
Sand Silt Clay
Figure 4.10 Schematic report comparison grains of sand, silt and clay.
Typical raw materials are shown in a figure below:
Clay Silt Sand Gravel Rocks Boulders
Figure 4.11 Typical appearances of clay, silt, sand, gravel, boulders and rocks.
Typical particle sizes for these different groups are shown in Table 4.1
            Table 4.1 Grain sizes.
Boulders Rocks Gravel Sand Silt Clay
100 mm
60 mm
60 mm – 2 mm 2 mm – 0,063 mm 63 μm - 0,002 μm < 0,002 μm
  Raw materials
   Grain size
             62
