
Page 19 - Proof no 3
P. 19
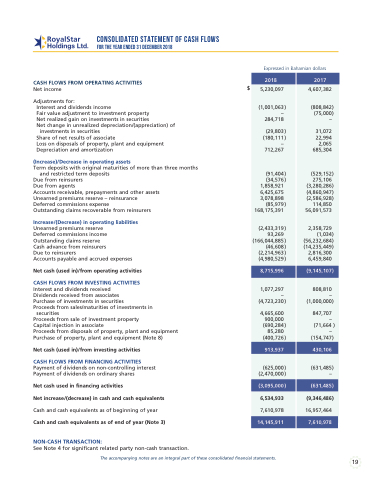
 CONSOLIDATED STATEMENT OF CASH FLOWS FOR THE YEAR ENDED 31 DECEMBER 2018
CASH FLOWS FROM OPERATING ACTIVITIES
Net income
Adjustments for:
Interest and dividends income
Fair value adjustment to investment property
Net realized gain on investments in securities
Net change in unrealized depreciation/(appreciation) of
investments in securities
Share of net results of associate
Loss on disposals of property, plant and equipment Depreciation and amortization
(Increase)/Decrease in operating assets
Term deposits with original maturities of more than three months and restricted term deposits
Due from reinsurers
Due from agents
Accounts receivable, prepayments and other assets Unearned premiums reserve – reinsurance Deferred commissions expense
Outstanding claims recoverable from reinsurers
Increase/(Decrease) in operating liabilities
Unearned premiums reserve Deferred commissions income Outstanding claims reserve Cash advance from reinsurers Due to reinsurers
Accounts payable and accrued expenses
Net cash (used in)/from operating activities
CASH FLOWS FROM INVESTING ACTIVITIES
Interest and dividends received
Dividends received from associates
Purchase of investments in securities
Proceeds from sales/maturities of investments in
securities
Proceeds from sale of investment property
Capital injection in associate
Proceeds from disposals of property, plant and equipment Purchase of property, plant and equipment (Note 8)
Net cash (used in)/from investing activities
√
CASH FLOWS FROM FINANCING ACTIVITIES
Payment of dividends on non-controlling interest Payment of dividends on ordinary shares
Net cash used in financing activities
Net increase/(decrease) in cash and cash equivalents Cash and cash equivalents as of beginning of year Cash and cash equivalents as of end of year (Note 3)
NON-CASH TRANSACTION:
Expressed in Bahamian dollars
$
                          2018
2017
5,230,097
(1,001,063 ) –
284,718
(29,803 ) (180,111 )
– 712,267
(91,404 )
(34,576 ) 1,858,921 6,425,675 3,078,898
(85,979 ) 168,175,391
(2,433,319 ) 93,269
(166,044,885 ) (46,608 ) (2,214,963 ) (4,980,529 )
4,607,382
(808,842) (75,000)
–
31,072 22,994 2,065 685,304
(529,152) 275,106
(3,280,286) (4,860,947) (2,586,928)
114,850 56,091,573
2,358,729 (1,034) (56,232,684) (14,235,449)
2,816,300 6,459,840
8,715,996
(9,145,107)
1,077,297 –
(4,723,230 )
4,665,600 900,000
(690,284 ) 85,280 (400,726 )
808,810 –
(1,000,000)
847,707 –
(71,664 ) –
(154,747)
913,937
430,106
(625,000 ) (2,470,000 )
(631,485) –
(3,095,000 )
(631,485)
6,534,933
7,610,978
(9,346,486)
16,957,464
14,145,911
7,610,978
      See Note 4 for significant related party non-cash transaction.rrying value of the treasury shares as of the date of The accompanying notes are an integral part of these consolidated financial statements.
19
