
Page 139 - Food Outlook
P. 139
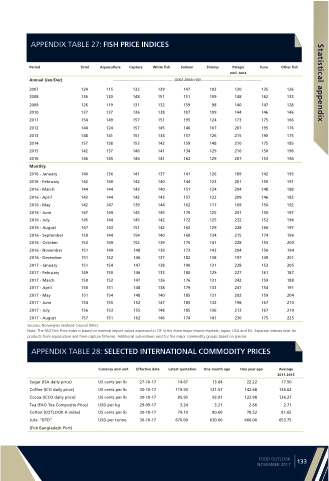
  APPENDIX TABLE 27: FISH PRICE INDICES
Period
Annual (Jan/Dec)
2007
2008
2009
2010
2011
2012
2013
2014
2015
2016
Monthly
2016 - January 2016 - February 2016 - March 2016 - April
2016 - May
2016 - June
2016 - July
2016 - August 2016 - September 2016 - October 2016 - November 2016 - December 2017 - January 2017 - February 2017 - March 2017 - April
2017 - May 2017 - June 2017 - July 2017 - August
Total Aquaculture Capture White fish Salmon Shrimp Pelagic Tuna excl. tuna
.................................................................. (2002-2004=100) ..................................................................
Other fish
 124 115 132 139 147 136 120 148 151 151 126 119 131 132 159 137 137 136 138 187 154 149 157 151 195 144 124 157 145 146 148 141 151 134 157 157 158 153 142 159 142 137 146 141 134 146 145 146 141 162
140 136 141 137 141 142 140 142 140 144 144 144 143 140 151 143 144 142 143 157 142 147 139 144 162 147 149 145 145 170 145 144 145 142 172 147 143 151 142 162 150 144 154 140 160 152 149 152 139 170 151 149 148 139 173 151 152 146 137 182 151 154 147 138 190
149 150 146 133 180
150 152 147 136 176
150 151 148 138 179
151 154 148 140 185
154 155 152 147 185
156 153 155 148 185
157 151 162 146 174
102 130 109 148 98 140 109 144 124 173 107 207 126 215 148 210 129 216 129 207
126 189 123 201 124 204 122 209 117 169 125 201 125 232 129 228 134 215 141 228 143 204 138 197 131 228 129 227 131 242 133 241 131 202 132 198 136 213 141 230
135 126 162 133 147 128 146 146 175 166 195 176 190 175 175 185 150 196 153 194
142 193 150 191 148 188 146 183 150 192 150 197 152 194 166 197 174 196 155 200 150 194 149 201 153 205 161 187 159 188 154 191 159 204 167 210 167 219 175 225
  Source= Norwegian Seafood Council (NSC).
Note: The FAO Fish Price Index is based on nominal import values expressed in CIF in the three major import markets; Japan, USA and EU. Separate indexes exist for products from aquaculture and from capture fisheries. Additional sub-indexes exist for the major commodity groups based on species.
  APPENDIX TABLE 28: SELECTED INTERNATIONAL COMMODITY PRICES
 Sugar (ISA daily price)
Coffee (ICO daily price)
Cocoa (ICCO daily price)
Tea (FAO Tea Composite Price) Cotton (COTLOOK A index) Jute “BTD”
(Fob Bangladesh Port)
Currency and unit
US cents per lb US cents per lb US cents per lb USD per kg
US cents per lb USD per tonne
Effective date
27-10-17 30-10-17 30-10-17 29-09-17 30-10-17 30-10-17
Latest quotation
14.67 119.50 95.93 3.24 79.10 670.00
One month ago
13.64 121.57 93.01 3.21 80.60 630.00
One year ago
22.22 142.68 122.98
2.66 78.52 660.00
Average 2011-2015
17.50 136.62 126.27
2.71 81.65 653.75
     FOOD OUTLOOK NOVEMBER 2017
133
Statistical appendix
