
Page 49 - Ecuador's Banana Sector under Climate Change
P. 49
chapter 2: economic and policy analysis of the banana sector in ecuador and implications for social and environmental sustainability
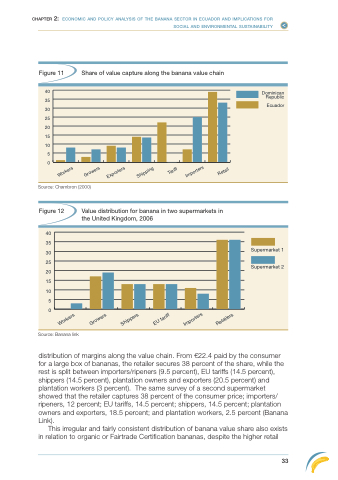
Figure 11 Share of value capture along the banana value chain
40 35 30 25 20 15 10
5 0
Dominican Republic
Ecuador
Source: Chambron (2000)
Figure 12 Value distribution for banana in two supermarkets in the United Kingdom, 2006
40
35
30
25
20
15
10
5 0
Supermarket 1 Supermarket 2
Source: Banana link
distribution of margins along the value chain. From €22.4 paid by the consumer for a large box of bananas, the retailer secures 38 percent of the share, while the rest is split between importers/ripeners (9.5 percent), EU tariffs (14.5 percent), shippers (14.5 percent), plantation owners and exporters (20.5 percent) and plantation workers (3 percent). The same survey of a second supermarket showed that the retailer captures 38 percent of the consumer price; importers/ ripeners, 12 percent; EU tariffs, 14.5 percent; shippers, 14.5 percent; plantation owners and exporters, 18.5 percent; and plantation workers, 2.5 percent (Banana Link).
This irregular and fairly consistent distribution of banana value share also exists in relation to organic or Fairtrade Certification bananas, despite the higher retail
33
Workers
Growers
Exporters
Shipping
Tariff
Importers
Retail
Workers
Growers
Shippers
EU tariff
Importers
Retailers
