
Page 205 - Libro 2
P. 205
12 — Ultrasound Following Interventional Procedures
185
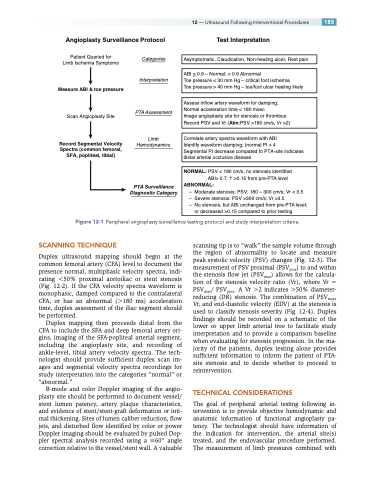
Angioplasty Surveillance Protocol
Test Interpretation
Patient Queried for Limb Ischemia Symptoms
Measure ABI & toe pressure
Scan Angioplasty Site
Record Segmental Velocity Spectra (common femoral, SFA, popliteal, tibial)
Categories
Interpretation
PTA Assessment
Limb Hemodynamics
PTA Surveillance Diagnostic Category
Asymptomatic, Claudication, Non-healing ulcer, Rest pain
ABI > 0.9 – Normal; < 0.9 Abnormal
Toe pressure < 30 mm Hg – critical foot ischemia
Toe pressure > 40 mm Hg – toe/foot ulcer healing likely
Assess inflow artery waveform for damping; Normal acceleration time < 180 msec
Image angioplasty site for stenosis or thrombus Record PSV and Vr (Abn:PSV >180 cm/s, Vr >2)
Correlate artery spectra waveform with ABI Identify waveform damping; (normal PI > 4
Segmental PI decrease compated to PTA-site indicates distal arterial occlusive disease
NORMAL: PSV < 180 cm/s, no stenosis identified ABI> 0.7, >0.15 from pre-PTA level
ABNORMAL:
– Moderate stenosis: PSV: 180 – 300 cm/s; Vr < 3.5 – Severe stenosis: PSV >300 cm/s; Vr >3.5
– No stenosis, but ABI unchanged from pre-PTA level;
or decreased >0.15 compared to prior testing
Figure 12-1 Peripheral angioplasty surveillance testing protocol and study interpretation criteria.
SCANNING TECHNIQUE
Duplex ultrasound mapping should begin at the common femoral artery (CFA) level to document the presence normal, multiphasic velocity spectra, indi- cating 50% proximal aortoiliac or stent stenosis (Fig. 12-2). If the CFA velocity spectra waveform is monophasic, damped compared to the contralateral CFA, or has an abnormal (180 ms) acceleration time, duplex assessment of the iliac segment should be performed.
Duplex mapping then proceeds distal from the CFA to include the SFA and deep femoral artery ori- gins, imaging of the SFA-popliteal arterial segment, including the angioplasty site, and recording of ankle-level, tibial artery velocity spectra. The tech- nologist should provide sufficient duplex scan im- ages and segmental velocity spectra recordings for study interpretation into the categories “normal” or “abnormal.”
B-mode and color Doppler imaging of the angio- plasty site should be performed to document vessel/ stent lumen patency, artery plaque characteristics, and evidence of stent/stent-graft deformation or inti- mal thickening. Sites of lumen caliber reduction, flow jets, and disturbed flow identified by color or power Doppler imaging should be evaluated by pulsed Dop- pler spectral analysis recorded using a 60° angle correction relative to the vessel/stent wall. A valuable
scanning tip is to “walk” the sample volume through the region of abnormality to locate and measure peak systolic velocity (PSV) changes (Fig. 12-3). The measurement of PSV proximal (PSVprox) to and within the stenosis flow jet (PSVmax) allows for the calcula- tion of the stenosis velocity ratio (Vr), where Vr PSVmax/ PSVprox. A Vr 2 indicates 50% diameter- reducing (DR) stenosis. The combination of PSVmax, Vr, and end-diastolic velocity (EDV) at the stenosis is used to classify stenosis severity (Fig. 12-4). Duplex findings should be recorded on a schematic of the lower or upper limb arterial tree to facilitate study interpretation and to provide a comparison baseline when evaluating for stenosis progression. In the ma- jority of the patients, duplex testing alone provides sufficient information to inform the patient of PTA- site stenosis and to decide whether to proceed to reintervention.
TECHNICAL CONSIDERATIONS
The goal of peripheral arterial testing following in- tervention is to provide objective hemodynamic and anatomic information of functional angioplasty pa- tency. The technologist should have information of the indication for intervention, the arterial site(s) treated, and the endovascular procedure performed. The measurement of limb pressures combined with
