
Page 4 - Non-motor Performance Report
P. 4
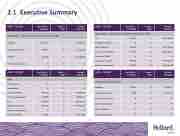
2.1 ExecutiveSummary
ACPC – YTD 2017
Loss Ratio – YTD 2017
Target – 2017
Actual – YTD 2017
Intermediary – Personal Lines (Non-schemes, Non-HSB)
Buildings
199,11%
R-
R23 381,00
Household Contents
56,93%
R-
R5 501,00
All Risks
86,53%
R-
R13 488,00
Electronic Equipment
-%
R-
R-
ACPC – YTD 2017
Loss Ratio – YTD 2017
Target – 2017
Actual – YTD 2017
Intermediary – Commercial Lines (Non-schemes, Non-HSB)
Fire
66,88%
R-
R55 084,63
Buildings Combined
-%
R-
R-
Office Contents
24,35%
R-
R10 787,08
Business Interruption
43,57%
R-
R185 568,10
Business All Risks
-%
R-
R-
Accidental Damage
36,36%
R-
R17 242,27
Electronic Equipment
35,40%
R-
R16 043,88
ACPC – YTD 2017
Loss Ratio – YTD 2017
Target – 2017
Actual – YTD 2017
AGRI
House owners
-%
R-
R-
Householders
-%
R-
R-
Personal All Risks
49,23%
R-
R8 688,20
Electronic Equipment
30,98%
R-
R9 697,17
Fire
83,84%
R-
R51 016,06
Buildings Combined
144,35%
R-
R47 830,63
Business Interruption
-%
R-
R-
Business All Risks
56,40%
R-
R12 674,89
ACPC – YTD 2017
Loss Ratio – YTD 2017
Target – 2017
Actual – YTD 2017
Sectional Title & Properties
Buildings
20,83%
R-
R4 580,01
Special Risks Geyser
100%
R-
R3 671,78
Business Interruption
-%
R-
R-
Accidental Damage
-%
R-
R-
Office Contents
-%
R-
R-
Applied Electronics
-%
R-
R-
4
