
Page 6 - HC Trends Report 2019
P. 6
COST OF LIVING
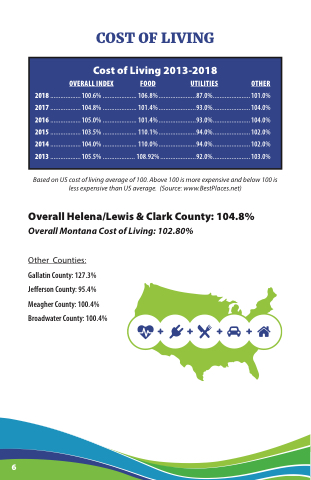
Cost of Living 2013-2018
OVERALL INDEX FOOD UTILITIES OTHER 2018 .................. 100.6% .................... 106.8% ......................87.0%...................... 101.0% 2017 .................. 104.8% .................... 101.4% ......................93.0%...................... 104.0% 2016 .................. 105.0% .................... 101.4% ......................93.0%...................... 104.0% 2015 .................. 103.5% .................... 110.1% ......................94.0%...................... 102.0% 2014 .................. 104.0% .................... 110.0% ......................94.0%...................... 102.0% 2013 .................. 105.5% ................... 108.92% .....................92.0%...................... 103.0%
Based on US cost of living average of 100. Above 100 is more expensive and below 100 is less expensive than US average. (Source: www.BestPlaces.net)
Overall Helena/Lewis & Clark County: 104.8%
Overall Montana Cost of Living: 102.80%
Other Counties:
Gallatin County: 127.3% Je erson County: 95.4% Meagher County: 100.4% Broadwater County: 100.4%
6
