
Page 7 - HC Trends Report 2019
P. 7
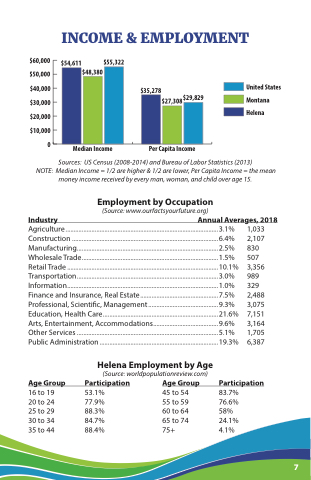
$60,000 $50,000 $40,000 $30,000 $20,000 $10,000
0
INCOME & EMPLOYMENT
$55,322
$54,611
$48,380
$35,278
$29,829
United States Montana Helena
Sources: US Census (2008-2014) and Bureau of Labor Statistics (2013)
NOTE: Median Income = 1/2 are higher & 1/2 are lower, Per Capita Income = the mean money income received by every man, woman, and child over age 15.
$27,308
Median Income
Per Capita Income
Employment by Occupation
(Source: www.ourfactsyourfuture.org)
Industry Annual Averages, 2018
Agriculture .............................................................................................. 3.1% Construction ..........................................................................................6.4% Manufacturing....................................................................................... 2.5% Wholesale Trade....................................................................................1.5% Retail Trade ............................................................................................. 10.1% Transportation.......................................................................................3.0% Information............................................................................................. 1.0% Finance and Insurance, Real Estate................................................7.5% Professional, Scienti c, Management ........................................... 9.3% Education, Health Care.......................................................................21.6% Arts, Entertainment, Accommodations........................................9.6% Other Services ....................................................................................... 5.1% Public Administration ......................................................................... 19.3%
1,033 2,107 830 507 3,356 989 329 2,488 3,075 7,151 3,164 1,705 6,387
Age Group
16 to 19 20 to 24 25 to 29 30 to 34 35 to 44
Helena Employment by Age
(Source: worldpopulationreview.com)
Participation Age Group
53.1% 45 to 54 77.9% 55 to 59 88.3% 60 to 64 84.7% 65 to 74 88.4% 75+
Participation
83.7% 76.6% 58% 24.1% 4.1%
7
