
Page 12 - BaselineReport 2017
P. 12
12
Outcomes
Austin Aspires will report community-wide data representing students in our public and private school systems.
The students were asked how often they experienced the five elements of developmental relationships at
home. These student responses are found below.
Glossary of Terms:
Kindergarten Assessment – Screening tool used at ACT - The ACT college readiness assessment is a
the start of Kindergarten to identify present levels of standardized test for high school achievement and
performance related to specific academic outcomes college admissions in the United States. The average
ACT score in Minnesota in 2016 was 21.7
NWEA/Scantron – Achievement assessments used
to measure each student’s progress or growth in 4- and 6-year HS Graduation Rates – Students
school, in language arts, and mathematics. Scores completing the required number of credits and
are reported using “growth” which is a method for specific coursework in four and six years.
measuring academic progress a student makes
between two points in time. 2-year Persistence Rates - Percent of high school
graduates starting college and persisting or
REACH - Students in grades 5, 7, and 9 took the REACH graduating in 2 years.
survey in the 2016-2017 school year. Students were
asked how often they experienced the five elements of Attendance Rates - Percent of students attending
developmental relationships at home. These student school on average.
responses are found below.
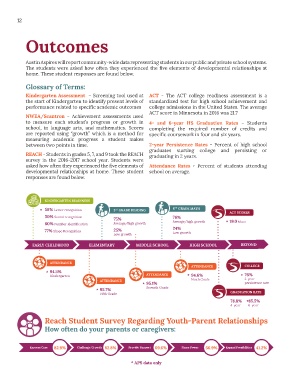
KINDERGARTEN READINESS
TH
* 58% Letter recognition 3 GRADE READING 8 GRADE MATH ACT SCORES
rd
30% Sound recognition 76%
75%
60% Number Identification Average/high growth Average/high growth * 19.0 Mean
77% Shape Recognition 25% 24%
Low growth
Low growth
EARLY CHILDHOOD ELEMENTARY MIDDLE SCHOOL HIGH SCHOOL BEYOND
ATTENDANCE
ATTENDANCE COLLEGE
* 94.5%
Kindergarten ATTENDANCE * 94.6% * 76%
ATTENDANCE Ninth Grade 2-year
* 95.1% persistence rate
* 95.7% Seventh Grade
Fifth Grade GRADUATION RATE
78.8% * 85.5%
4-year 6-year
Reach Student Survey Regarding Youth-Parent Relationships
How often do your parents or caregivers:
Express Care 82.9% Challenge Growth 82.8% Provide Support 69.6% Share Power 66.9% Expand Possibilities 41.2%
* APS data only