
Page 13 - CJO_W18
P. 13
CASE STUDY
A total of 739 surveys were completed over a period of about two months. Based on the final 797 potential subjects
who were approached, the survey completion rate was 69%. About 16% refused to take the survey, and 2% of the
returned surveys were incomplete. The remaining potential subjects could not complete the survey due to language
barriers (6%), disability (1%), because they were called in for their exam (3%) or because they had been dilated and
were unable to clearly see the survey items (3%).
Survey Instrument
The survey consisted of 10 items, with the first two from the PHQ-2 (Table 1). Included in the remaining items were
questions related to demographics (age, gender and ethnicity). A Likert scale was used for the PHQ-2. Data for each
completed survey were entered into an SPSS database for analysis.
RESULTS
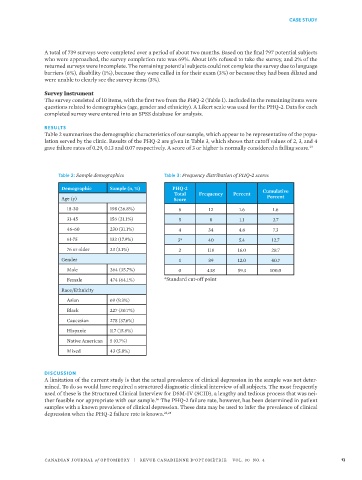
Table 2 summarizes the demographic characteristics of our sample, which appear to be representative of the popu-
lation served by the clinic. Results of the PHQ-2 are given in Table 3, which shows that cutoff values of 2, 3, and 4
gave failure rates of 0.29, 0.13 and 0.07 respectively. A score of 3 or higher is normally considered a failing score.
23
Table 2: Sample demographics Table 3: Frequency distribution of PHQ-2 scores
Demographic Sample (n, %) PHQ-2 Cumulative
Total Frequency Percent
Age (y) Score Percent
18-30 198 (26.8%) 6 12 1.6 1.6
31-45 156 (21.1%) 5 8 1.1 2.7
46-60 230 (31.1%) 4 34 4.6 7.3
61-75 132 (17.9%) 3* 40 5.4 12.7
76 or older 23 (3.1%) 2 118 16.0 28.7
Gender 1 89 12.0 40.7
Male 264 (35.7%) 0 438 59.3 100.0
Female 474 (64.1%) *Standard cut-off point
Race/Ethnicity
Asian 69 (9.3%)
Black 227 (30.7%)
Caucasian 278 (37.6%)
Hispanic 117 (15.8%)
Native American 5 (0.7%)
Mixed 43 (5.8%)
DISCUSSION
A limitation of the current study is that the actual prevalence of clinical depression in the sample was not deter-
mined. To do so would have required a structured diagnostic clinical interview of all subjects. The most frequently
used of these is the Structured Clinical Interview for DSM-IV (SCID), a lengthy and tedious process that was nei-
ther feasible nor appropriate with our sample. The PHQ-2 failure rate, however, has been determined in patient
36
samples with a known prevalence of clinical depression. These data may be used to infer the prevalence of clinical
depression when the PHQ-2 failure rate is known. 23,25
CANADIAN JOURNAL of OPTOMETRY | REVUE CANADIENNE D’OPTOMÉTRIE VOL. 80 NO. 4 13