
Page 10 - ELG1902
P. 10
RANKING 2019 .
Simplifying
the statistics
Melanie Butler reveals the trends hidden inside the inspection reports
he average quality of the language centres inspected by the Now let’s look at language centres. The mean average score of a
British Council is continuing to go up. After deducting any UK language centre is 5.5 the median average is five. The mean is
needs for improvement, the mean average number of areas close to the median. So far, the distribution of scores looks pretty
Tof strength awarded by inspectors, is now 5.5, up from 4.2 normal.
in 2017.
Does this mean that we’re looking at grade inflation? Statistically Standard Deviation
the answer is no. In fact, the distribution of scores awarded now looks About 68 per cent of US males re within four inches (10 centime-
much more like what you would normally expect than it was when we tres) of the average height. They are between 6 ft 2 (1.88 metres) and
first analysed the figures in 2008. Back then, 40 per cent of schools 5 ft 6 inches (1.67 metres) tall. Those four inches are the standard
scored zero points out of nine, and nobody at all got a perfect score. It deviation.
looked less like a neat bell curve and more like a very steep descending The standard deviation for language schools is four net areas of
staircase. strength. So, in a normal distribution curve most schools would score
To make a statistical analysis, we are using the number of net areas between four points above the mean and four points below. If we look
of strength rather than the adjusted score used in the ranking, not at schools scoring between 1 area of strength and nine, we find 76 per
least because it is the only way to calculate the change in scores over cent do.
time. But also to discover the way scores are distributed, we need to Seventy-six per cent is a little bit more than you would expect to see
use the raw data to calculate the standard deviation. in a normal distribution. That is, partly, because not many centres are
Help! Standard deviation, normal distribution, mean, average – isn’t more than one standard deviation below the mean.
this all getting a bit statistical? What next?
Bear with me. The statistics are really simple. Fat Tail
However, 17 per cent of centres are extremely good. Statistically
Mean and Median they are more than one standard deviation above the norm. That
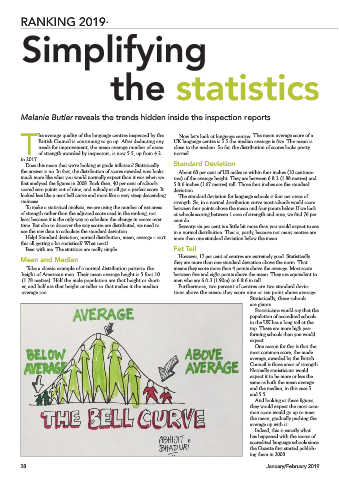
Take a classic example of a normal distribution pattern: the means they score more than 4 points above the average. Most score
height of American men. Their mean average height is 5 foot 10 between five and eight points above the mean. They are equivalent to
(1.78 metres). Half the male population are that height or short- men who are 6 ft 3 (1.90m) to 6 ft 6 in tall.
er, and half are that height or taller so that makes it the median Furthermore, two percent of centres are two standard devia-
average too. tions above the mean: they score nine or ten point above average.
Statistically, these schools
are giants.
Statisticians would say that the
population of accredited schools
in the UK has a long tail at the
top. There are more high per-
forming schools than you would
expect.
One reason for this is that the
most common score, the mode
average, awarded by the British
Council is three areas of strength.
Normally statisticians would
expect it to be more or less the
same as both the mean average
and the median, in this case 5
and 5.5.
And looking at these figures,
they would expect the most com-
mon score would go up to meet
the mean, gradually pushing the
average up with it.
Indeed, this is exactly what
has happened with the scores of
accredited language schools since
the Gazette first started publish-
ing them in 2008.
28 January/February 2019